System Monitoring
System Monitoring displays real-time hardware sensor data inside SignalRGB. You can view temperatures, clock speeds, load percentages, and more without switching to a separate monitoring tool. Widgets are how you view this data — each one shows a sensor you choose, styled the way you want.
Creating and Customizing Widgets
Section titled “Creating and Customizing Widgets”Widgets are how you view system monitoring information. When you create a widget, you assign a sensor to monitor and choose how to display its data. You can adjust each widget’s size and position on the Monitoring page.
- Click Add Widget in the upper-right corner of the page.
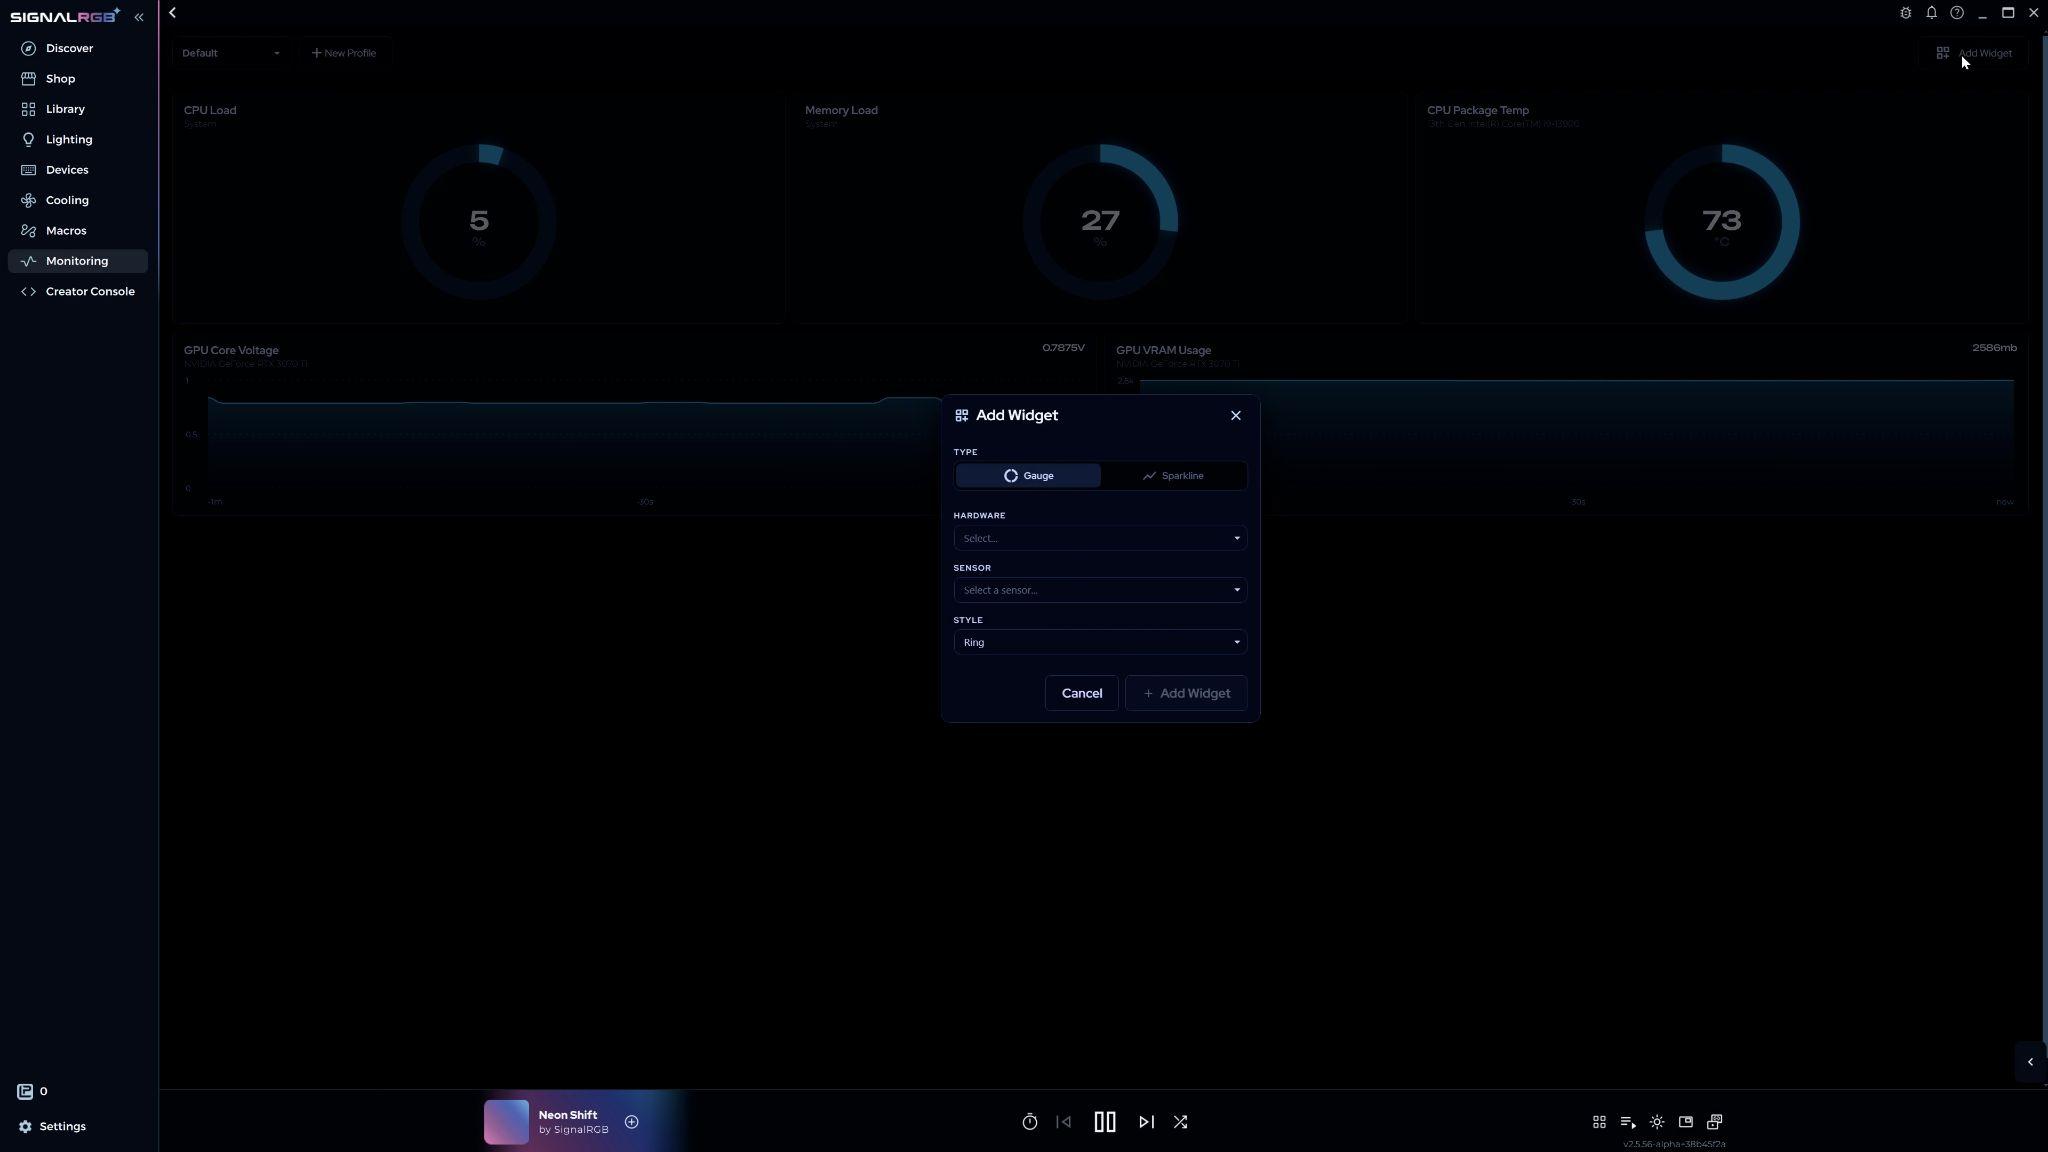
- A menu opens with four choices: graph type, hardware, sensor, and style. Select the options that match what you want to monitor, then click Add Widget.
There are two widget types:
- Gauge — shows the current value at a glance
- Sparkline — shows data over time as a line graph
Hardware is the component you want to monitor. Sensor is the specific data point, such as temperature or clock speed. Style changes the visual appearance.
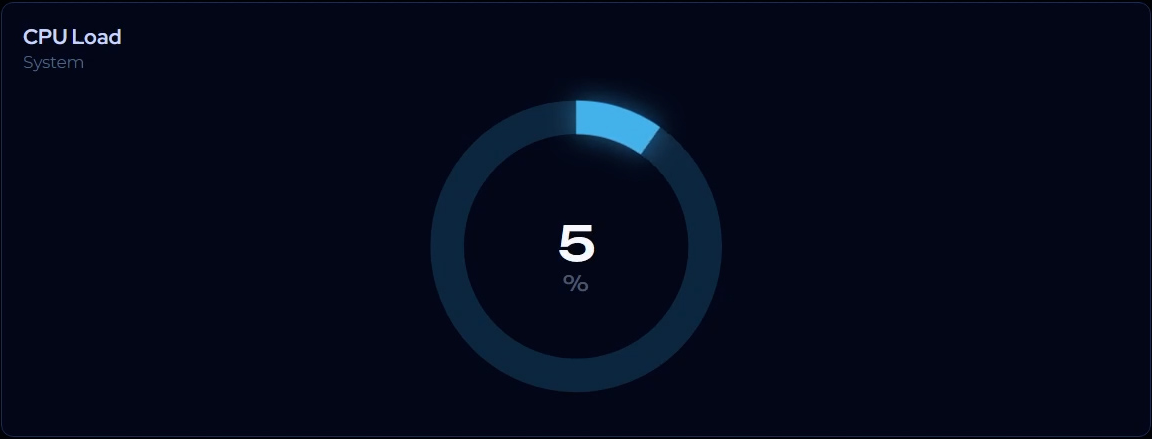 | 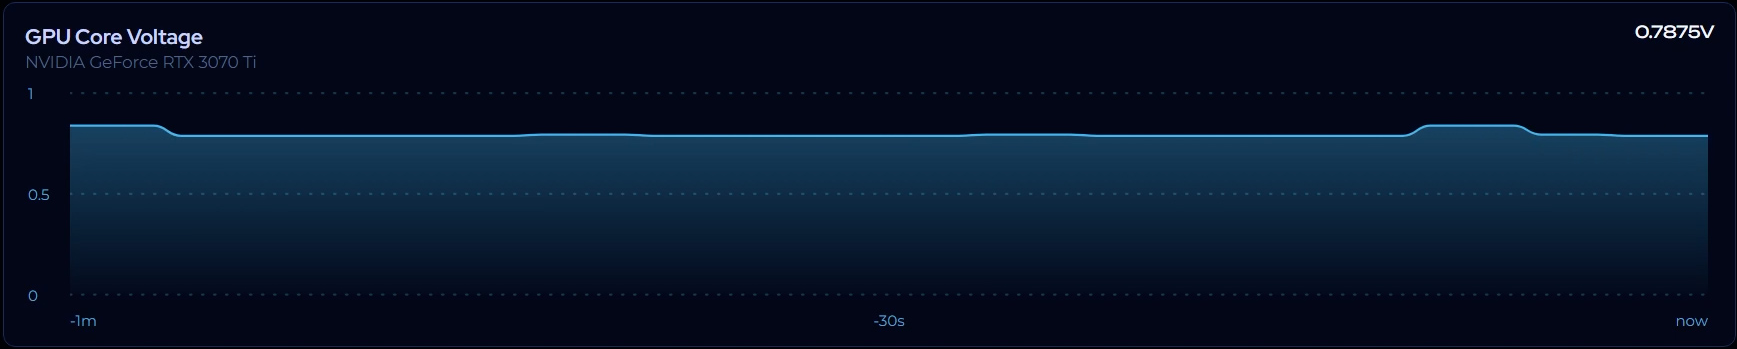 |
| Gauge Widget | Sparkline Widget |
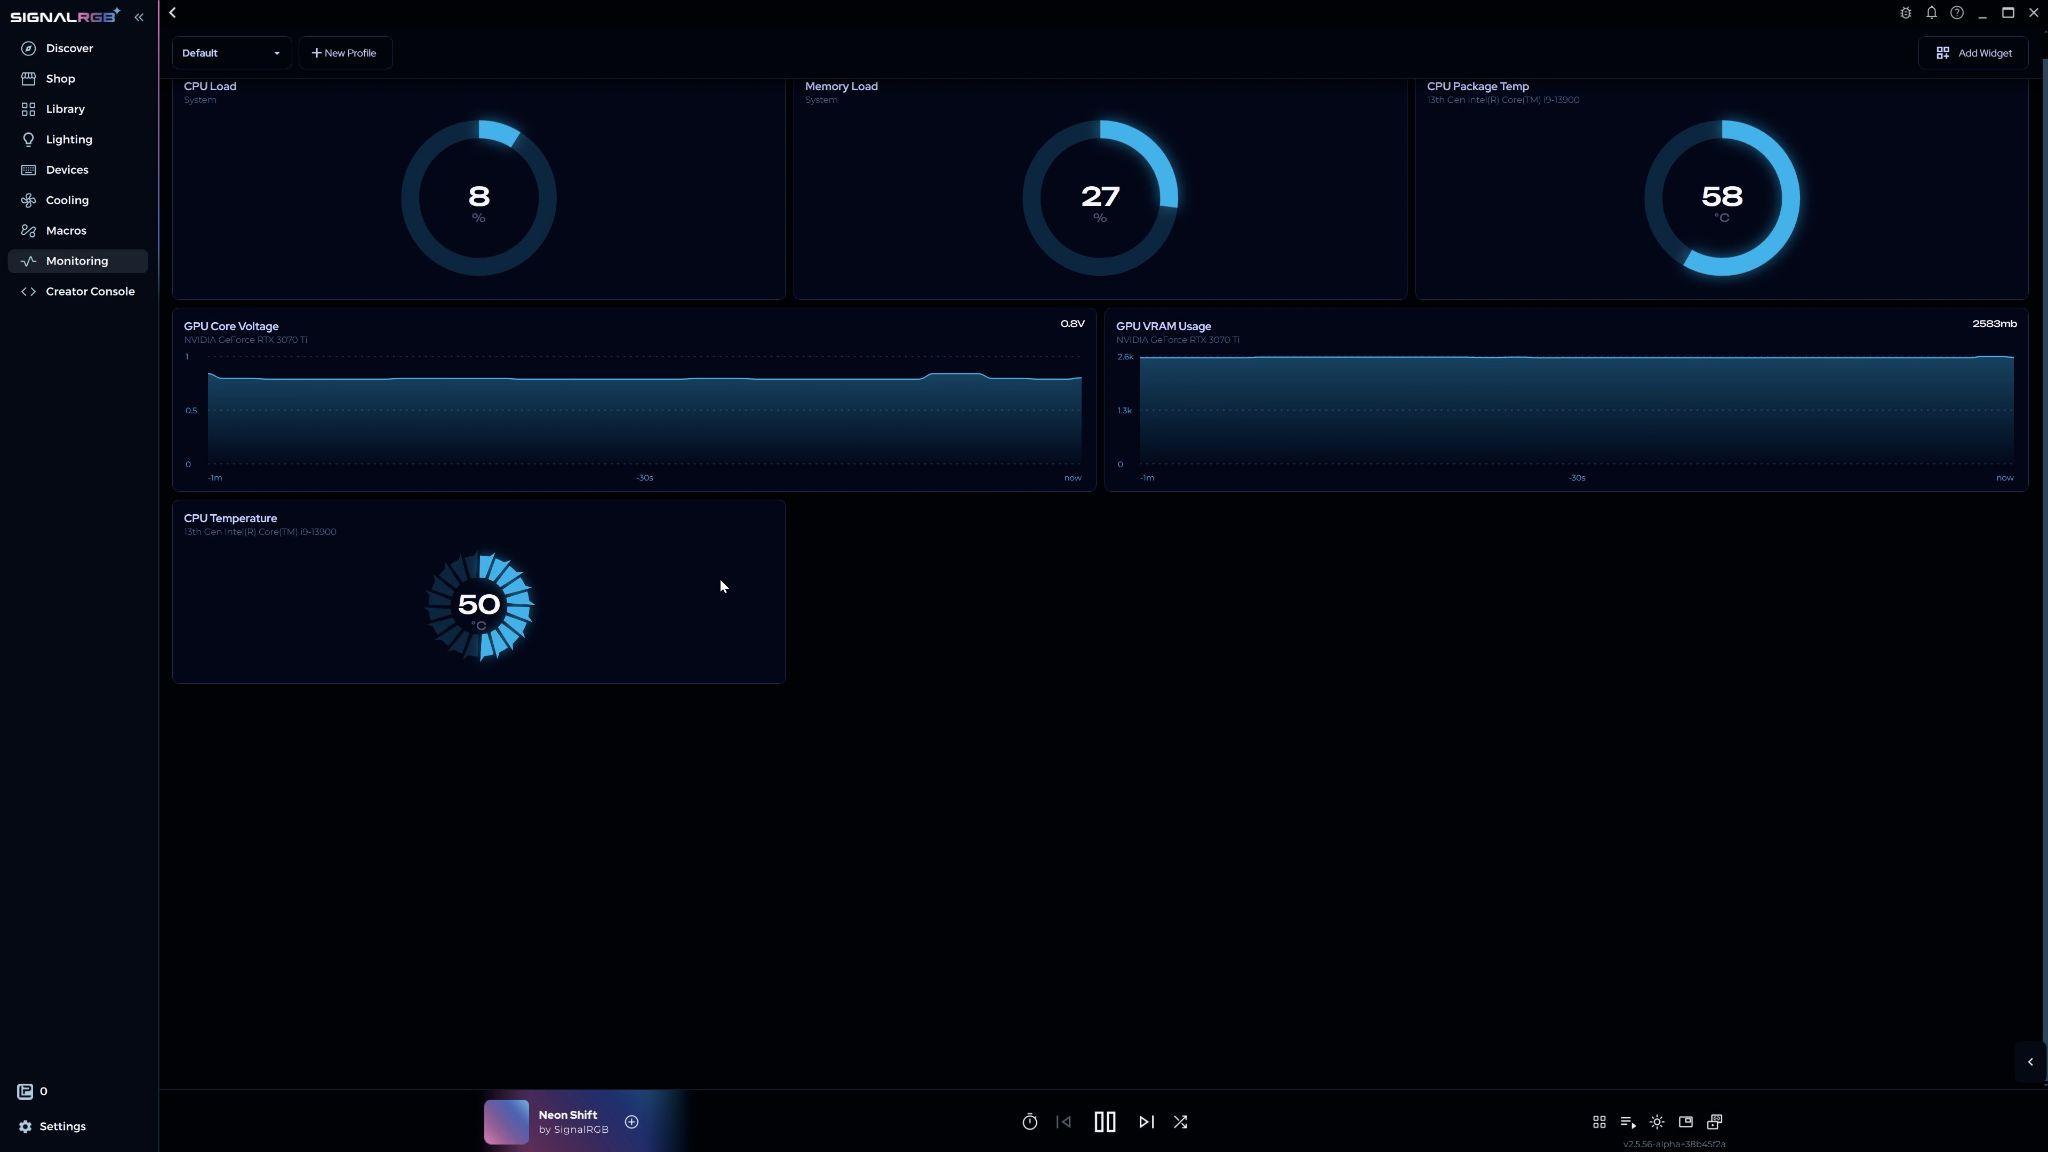
The new widget appears on the Monitoring page.
Editing a Widget
Section titled “Editing a Widget”Hover over any widget and click the Settings button to open the full customization menu. A preview updates as you make changes.
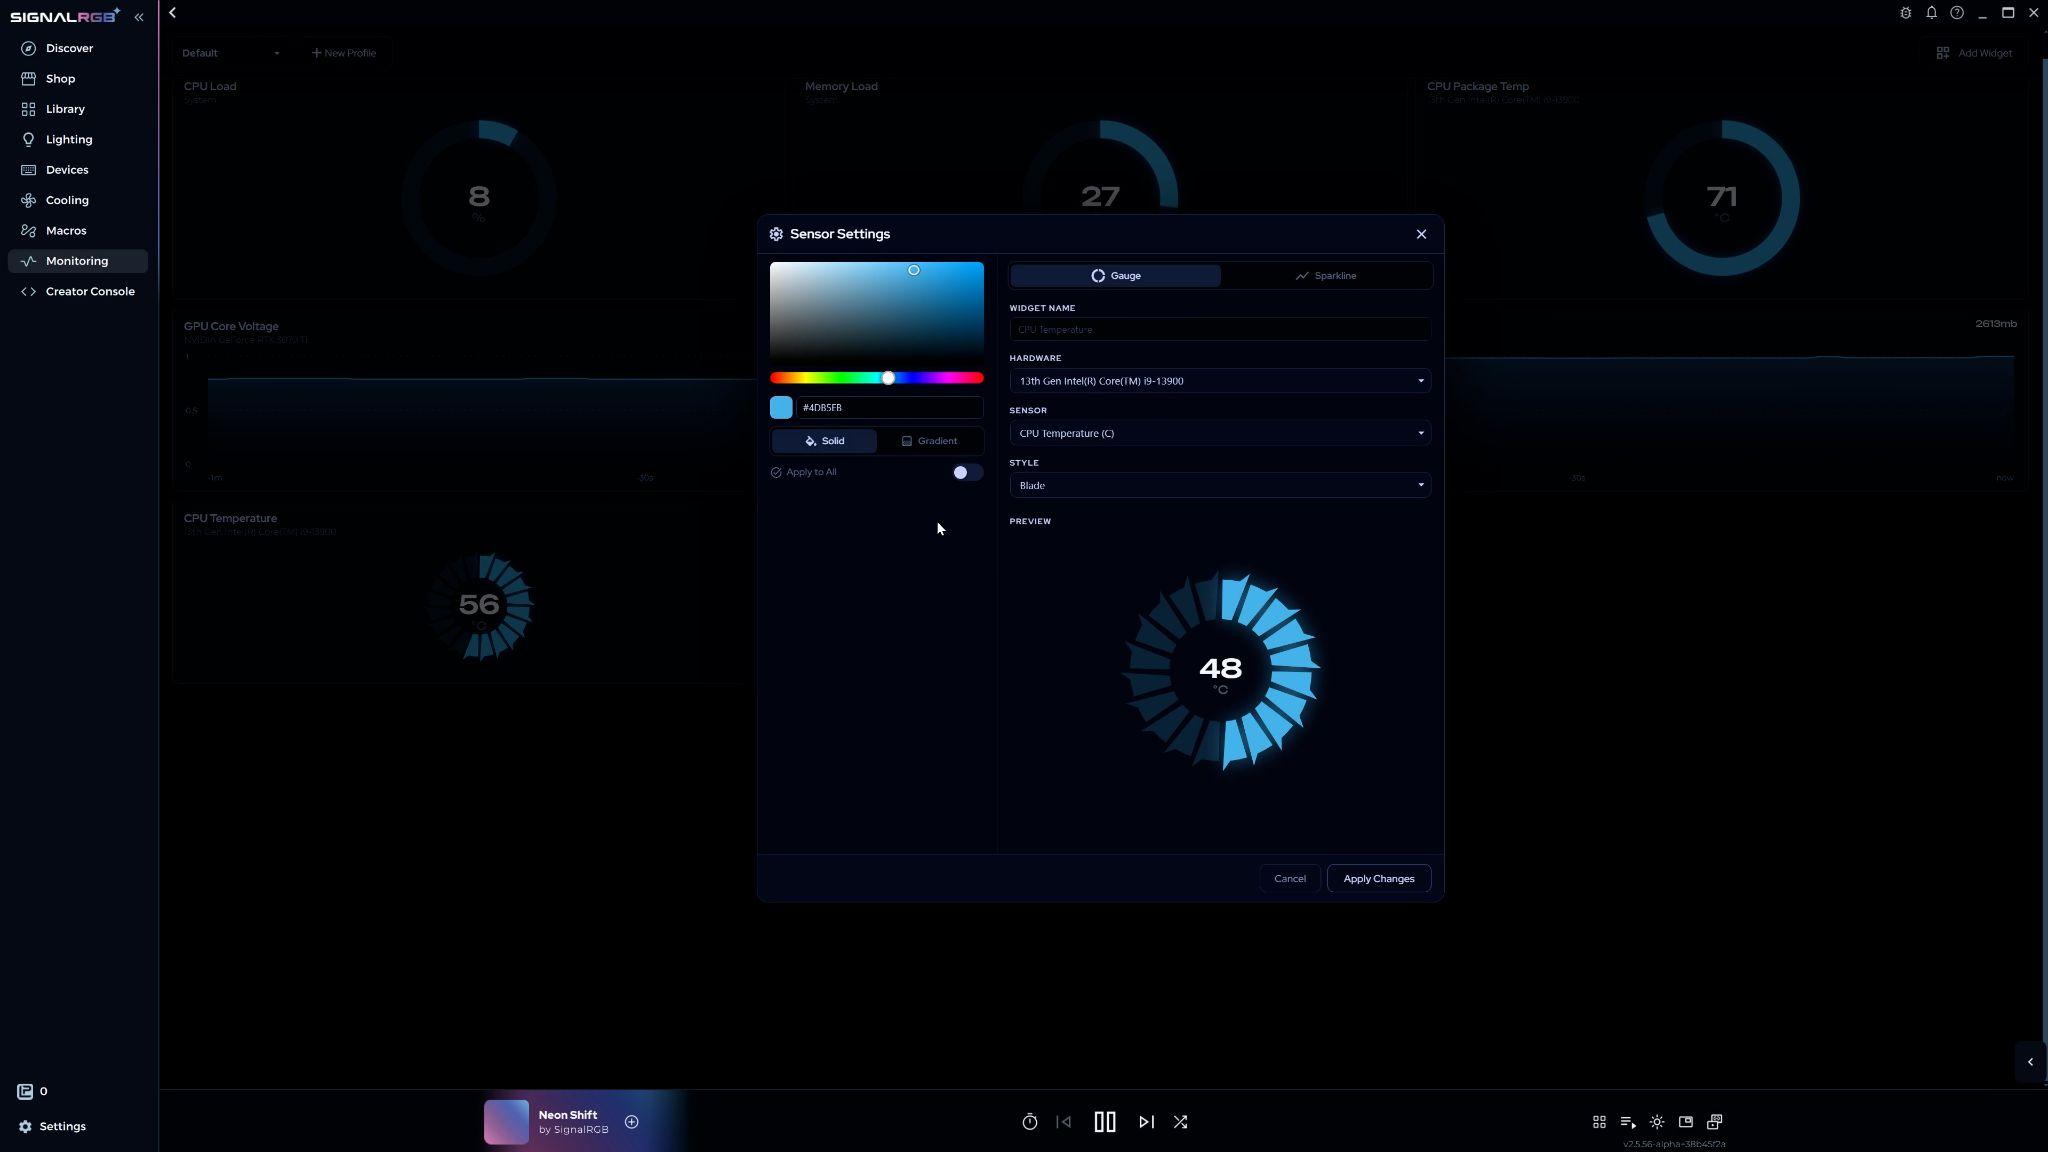
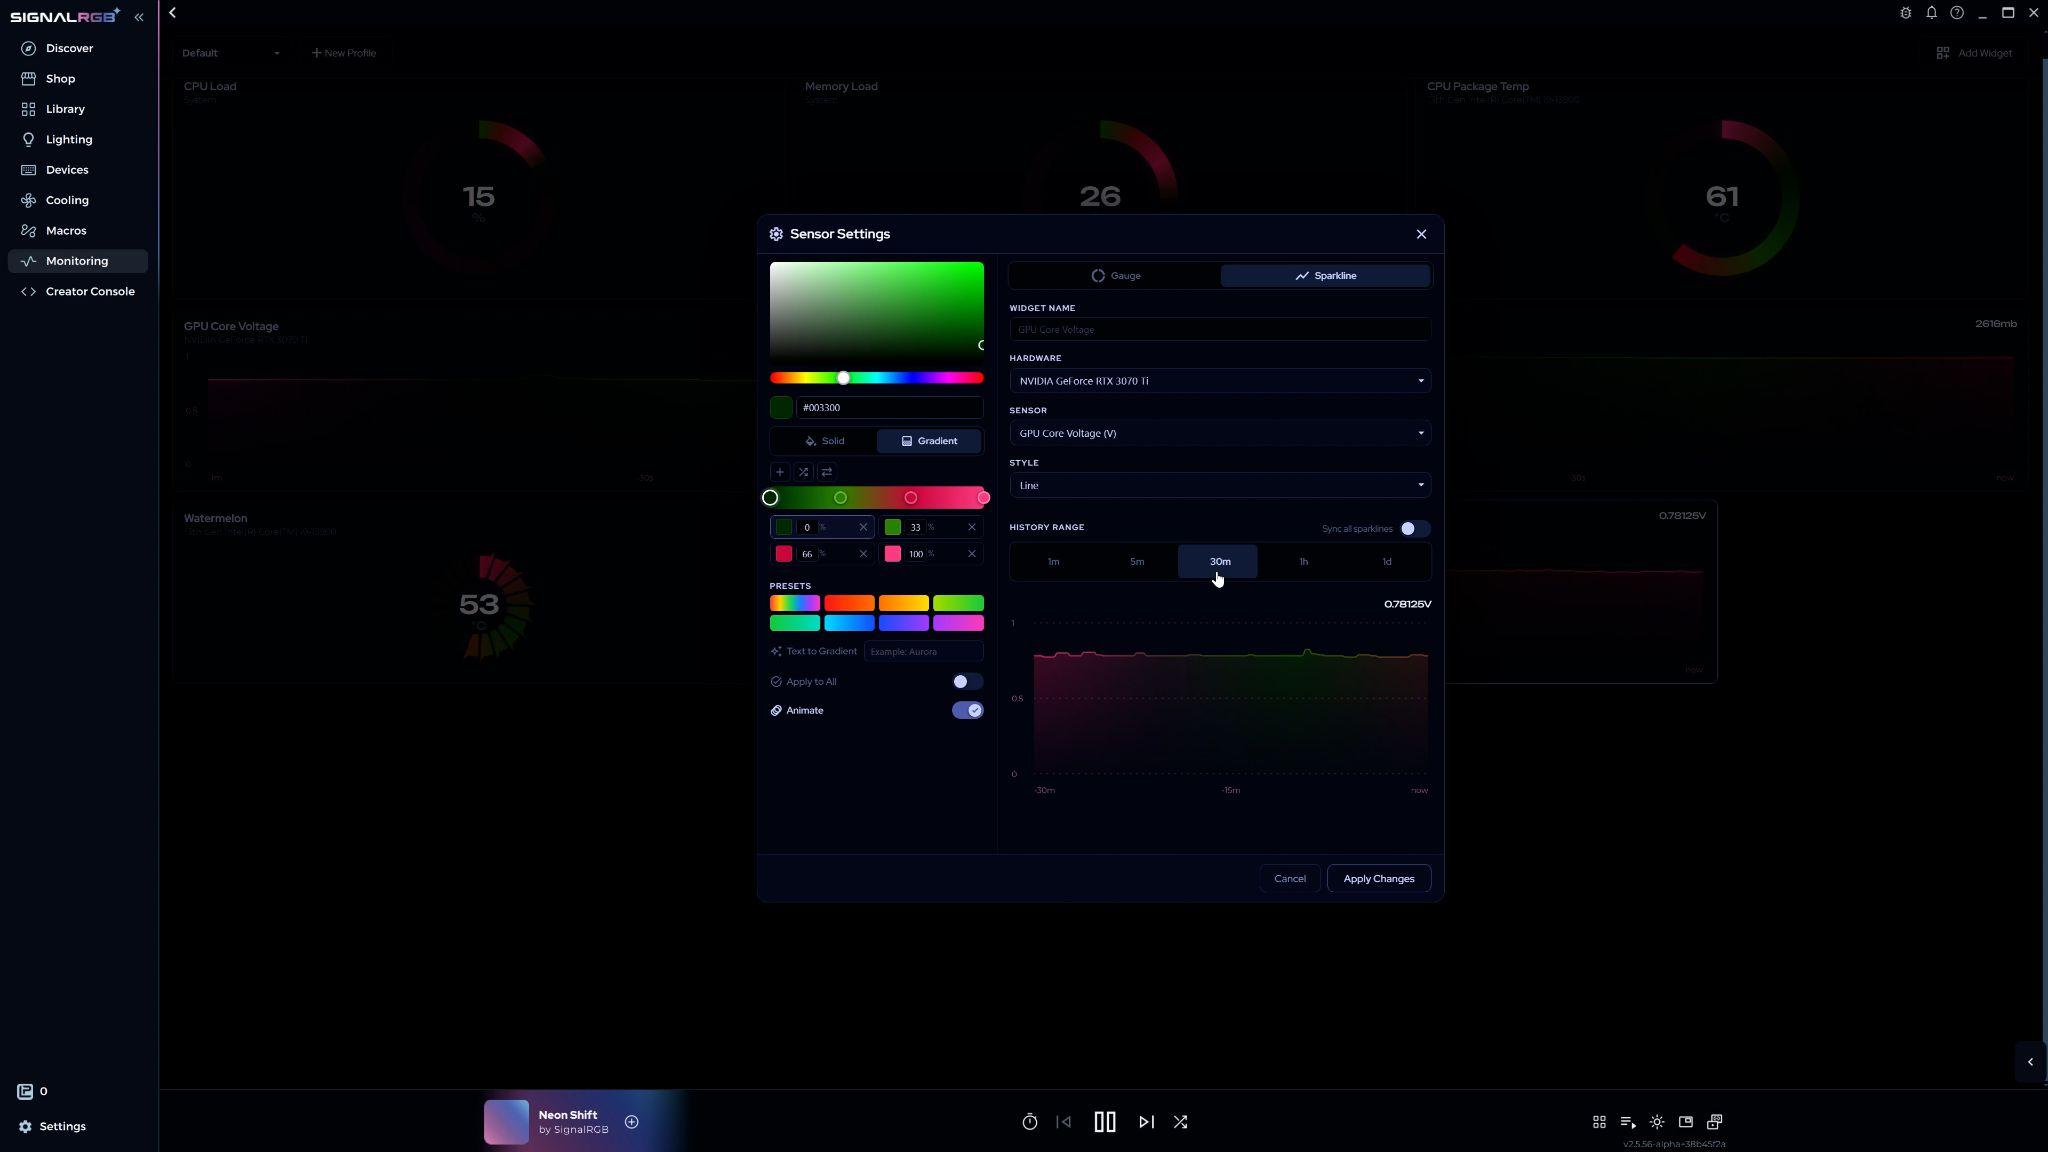
From here you can change the graph type, hardware, sensor, and style you selected when creating the widget. For Sparkline widgets, you can also adjust the time range of data displayed, from 1 minute to 24 hours.
Widget Color
Section titled “Widget Color”Widgets can be a solid color or a gradient. By default they use a solid color.
To set a solid color, pick from the color range graph or enter a hex code. Toggle Apply to all to apply the same color to every widget at once.
Gradients
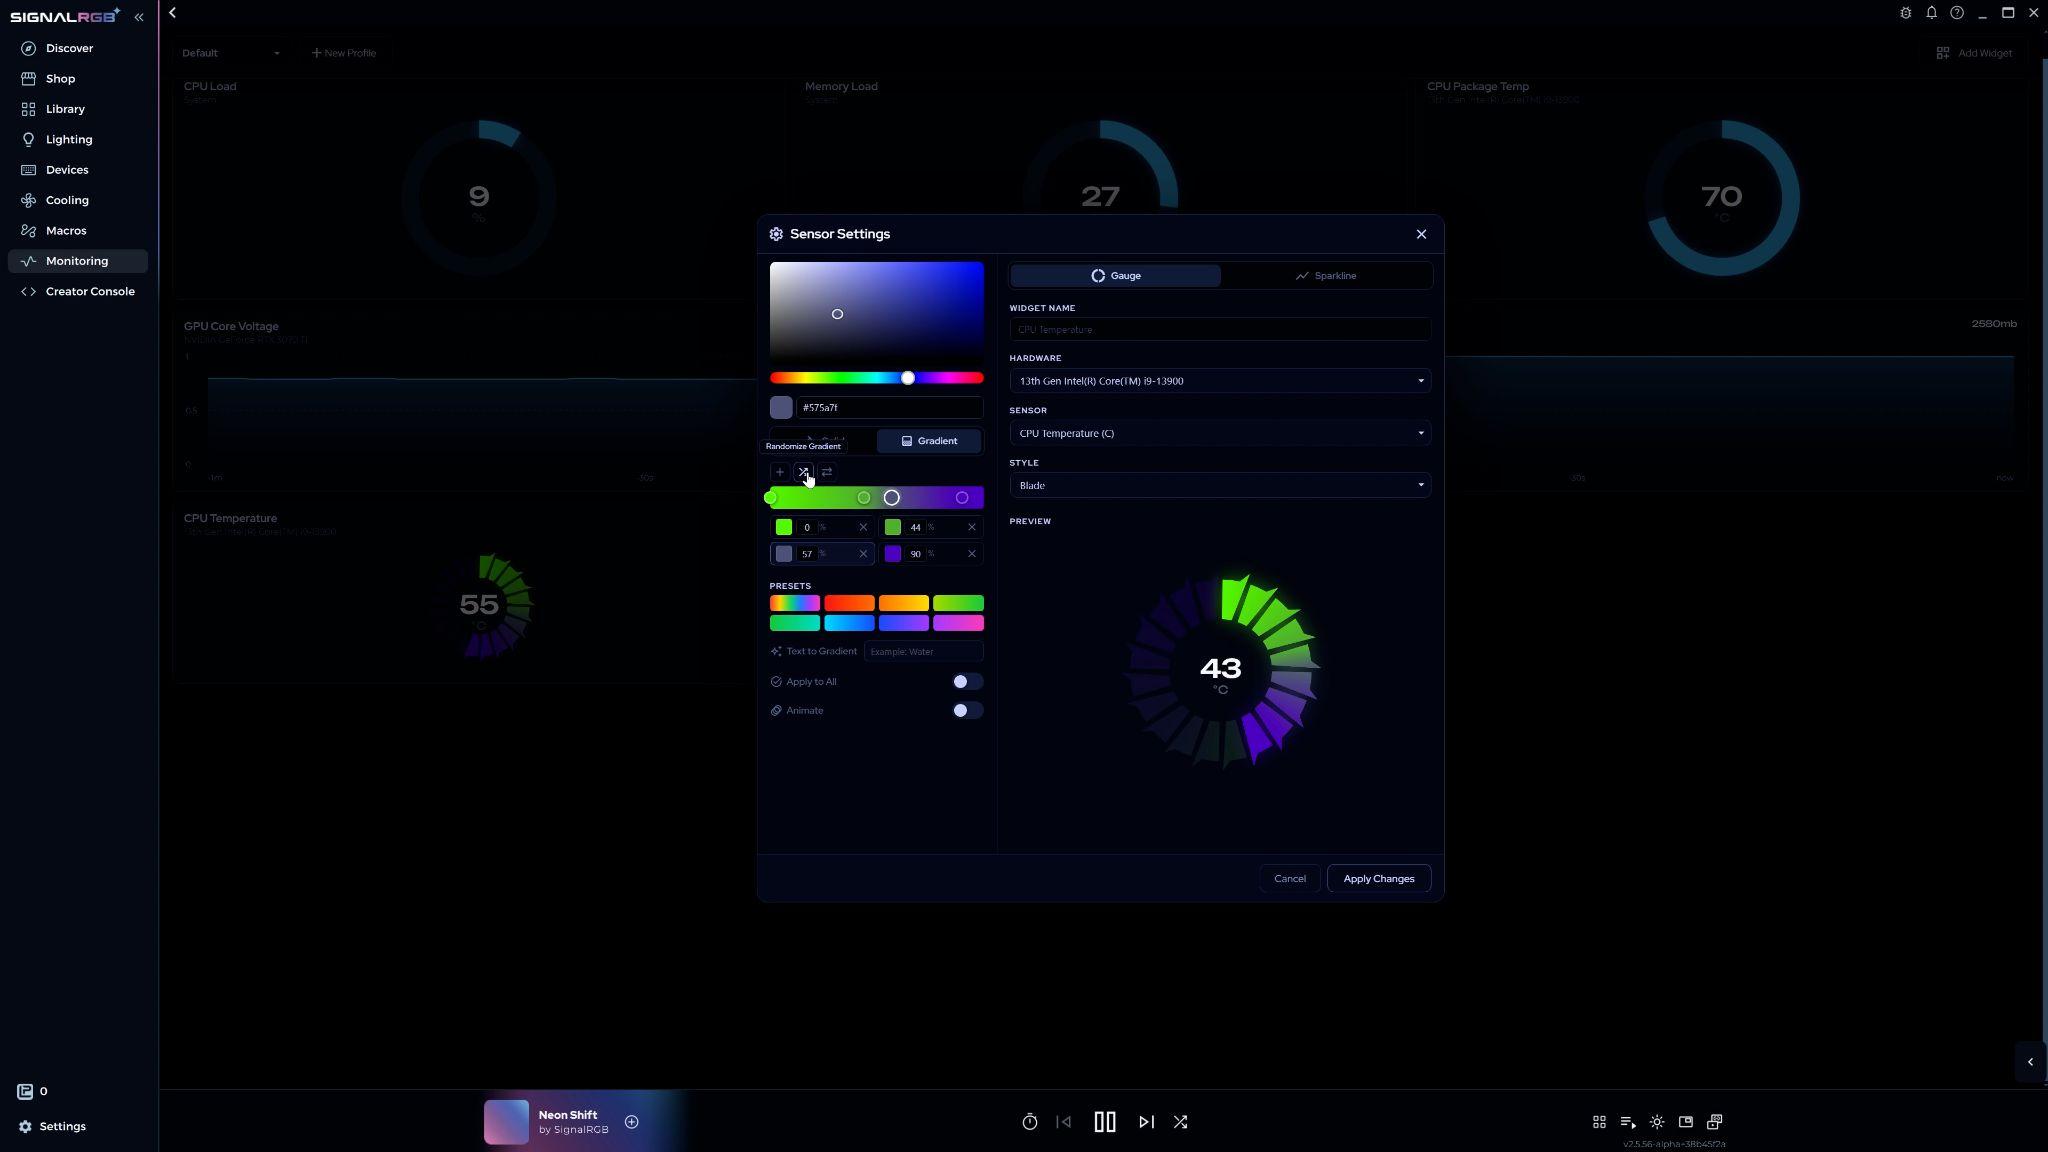
Section titled “Gradients”Click the solid/gradient toggle to switch to gradient mode.
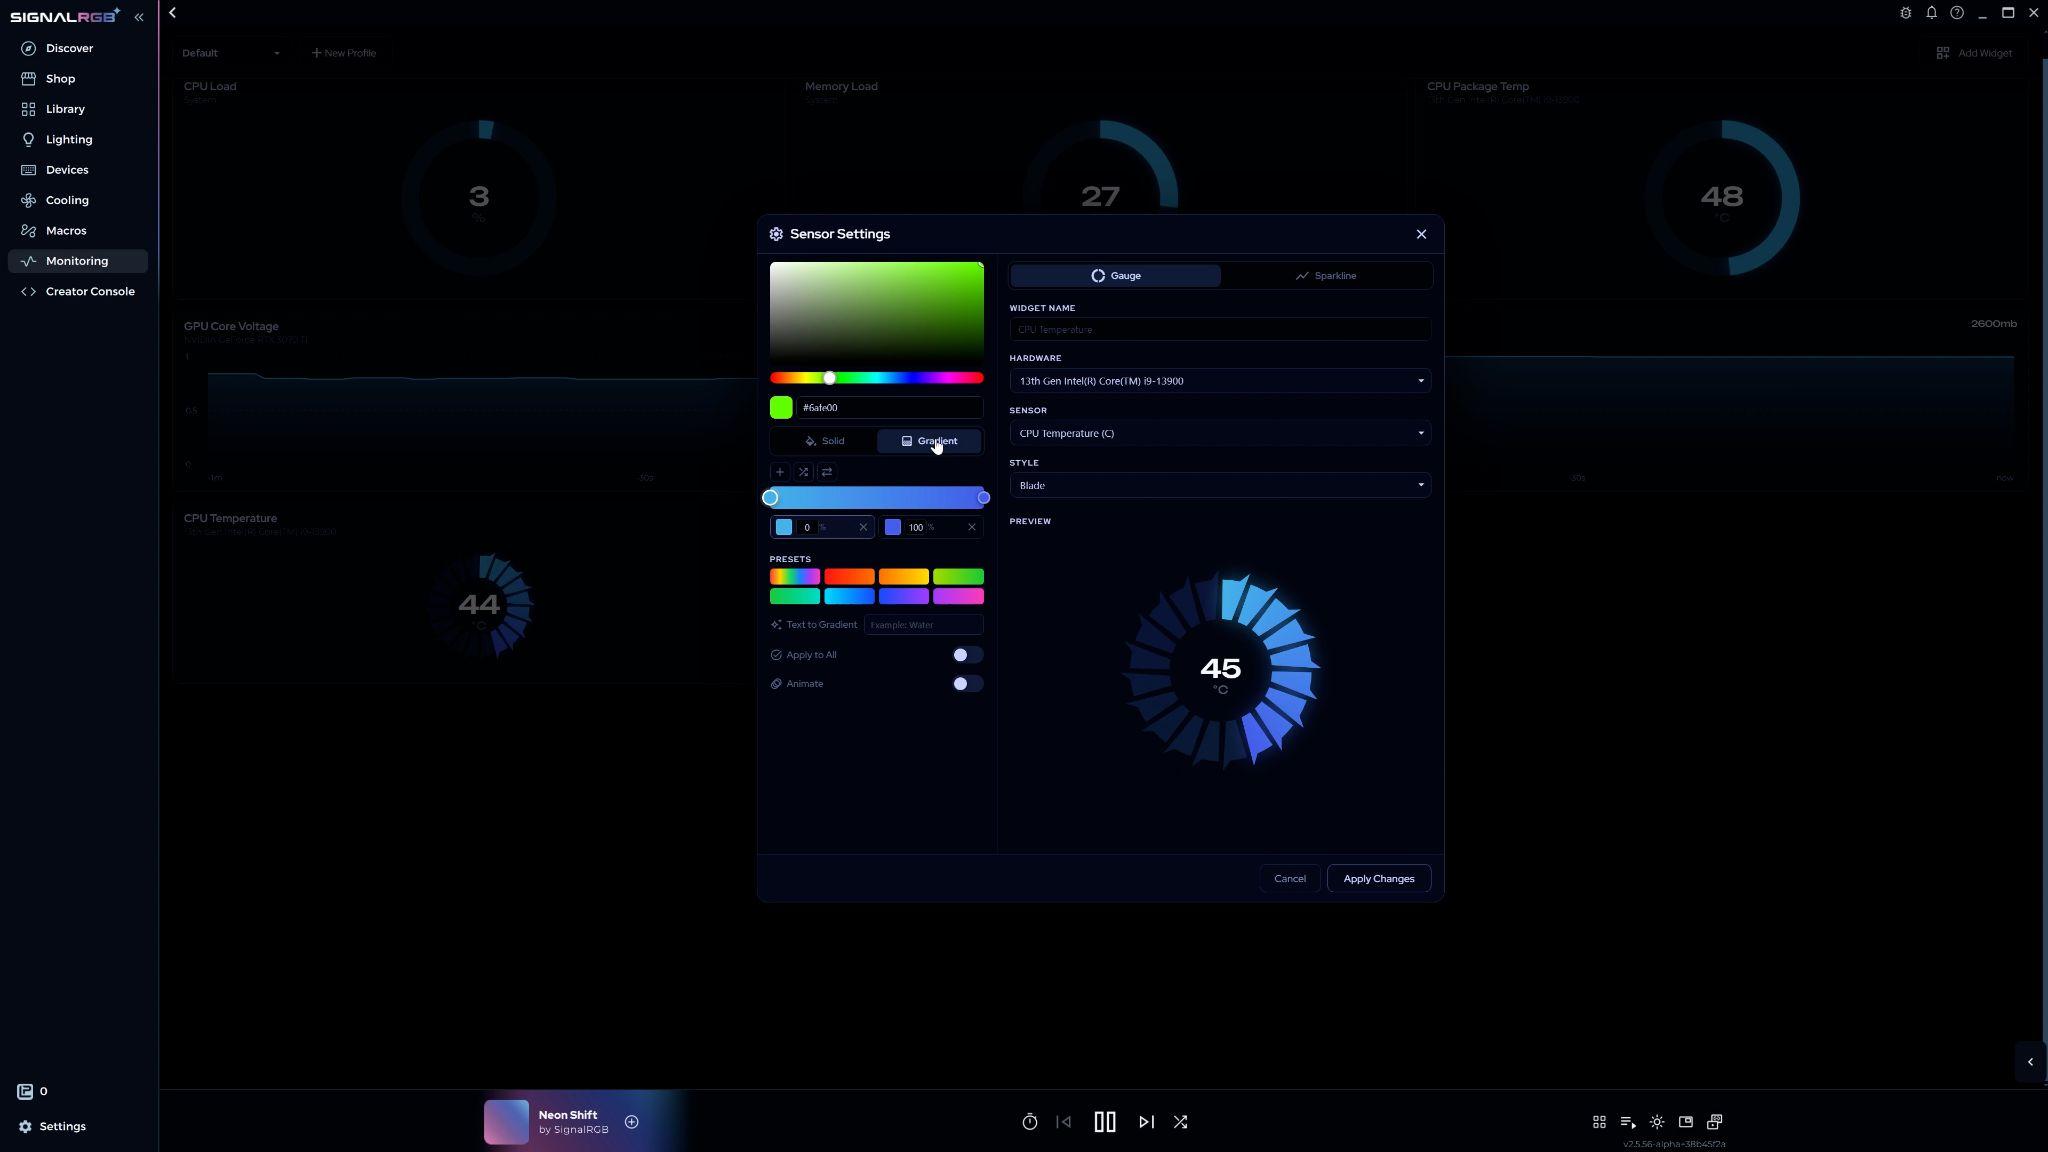
The color bar shows your gradient. The stops on the bar represent each color in the gradient.
- To change a color, click a stop on the bar or select it from the menu below, then adjust it in the color graph.
- To shift how much of the gradient a color occupies, click and drag the stop along the bar. Fine-tune the position in the menu below.
- To add a stop, click Add Stop or click anywhere on the bar.
- To delete a stop, right-click it on the bar or click its delete button in the menu below.
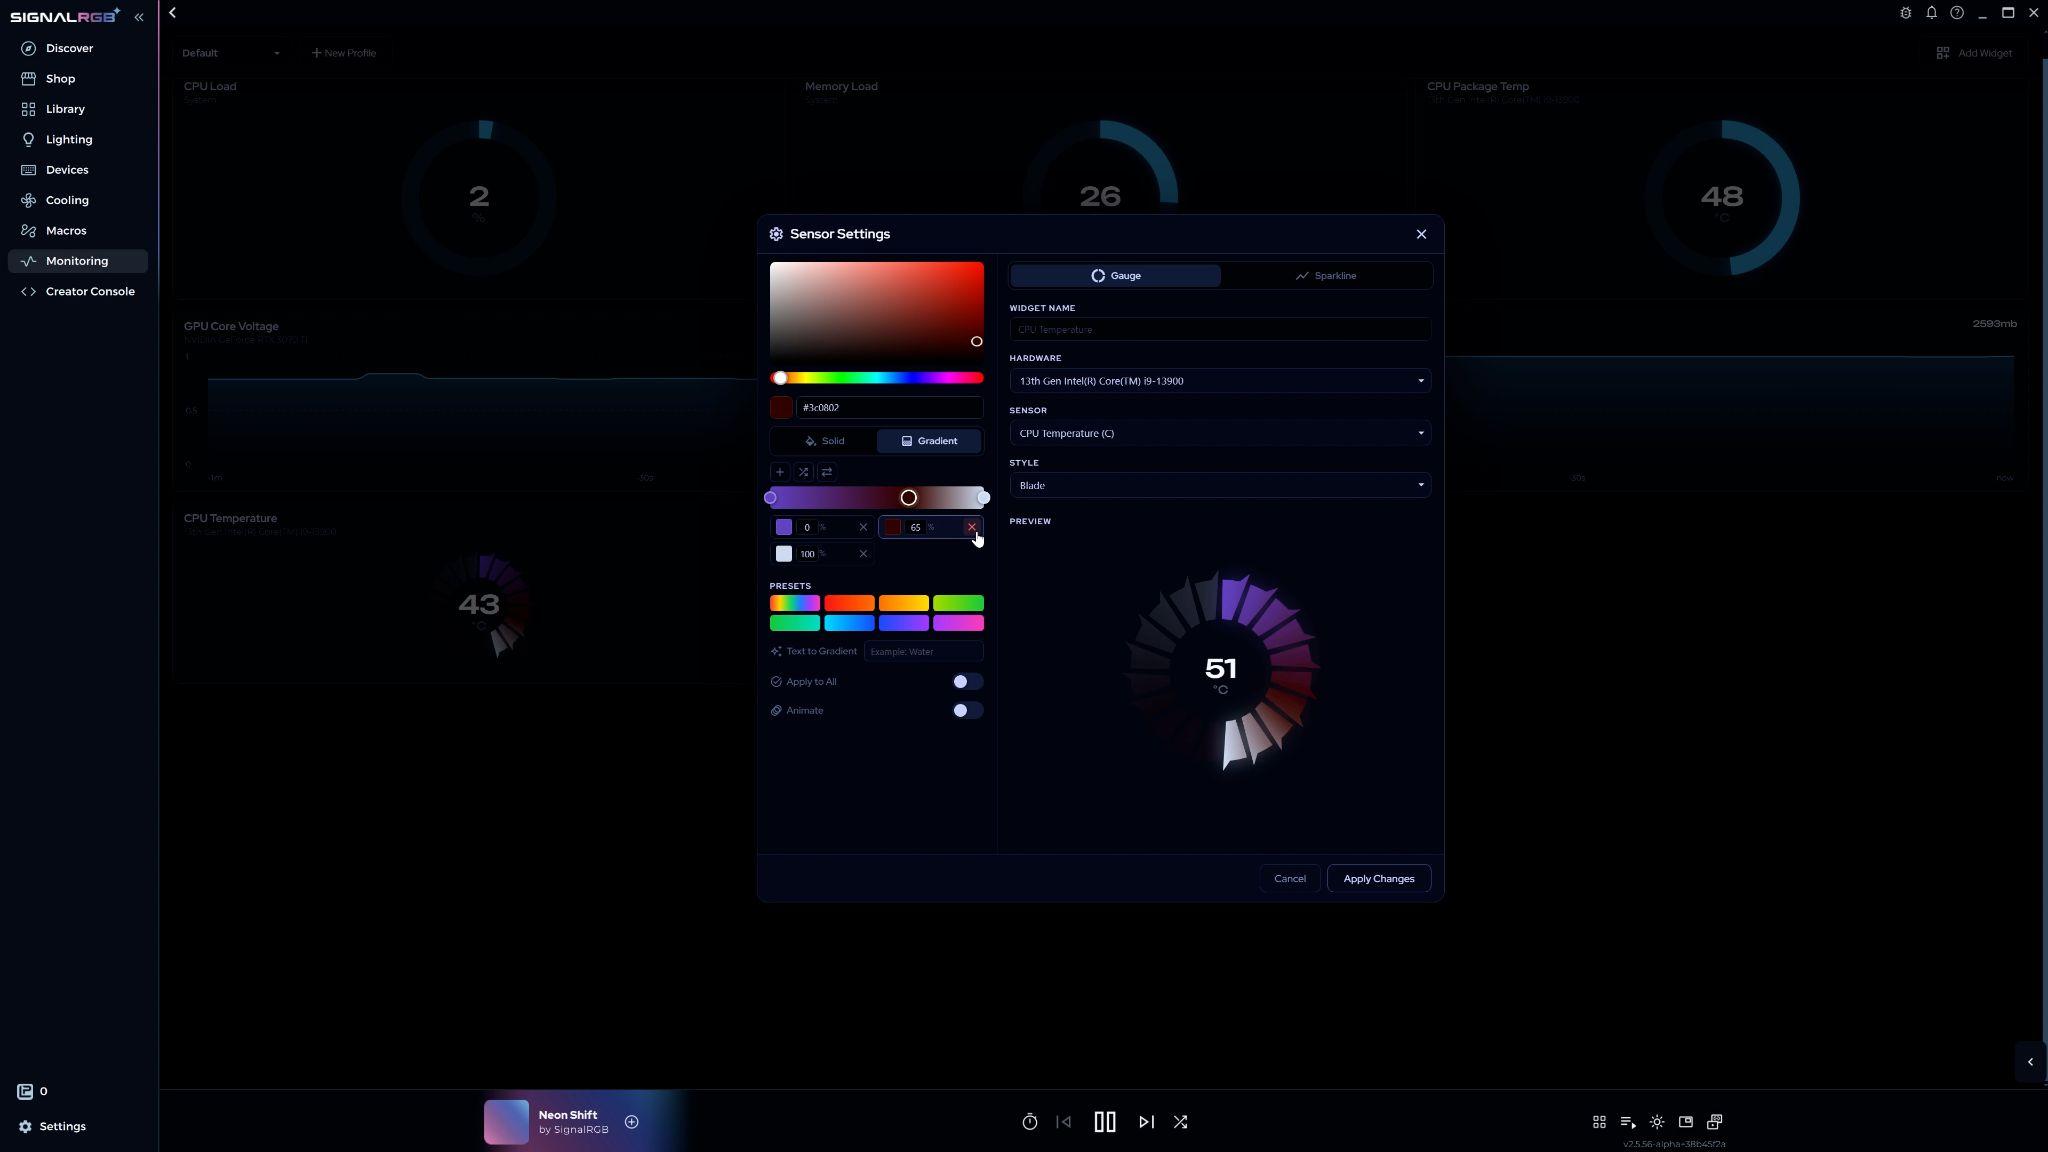
Randomize Gradient generates a random design. Flip Gradient mirrors it horizontally.
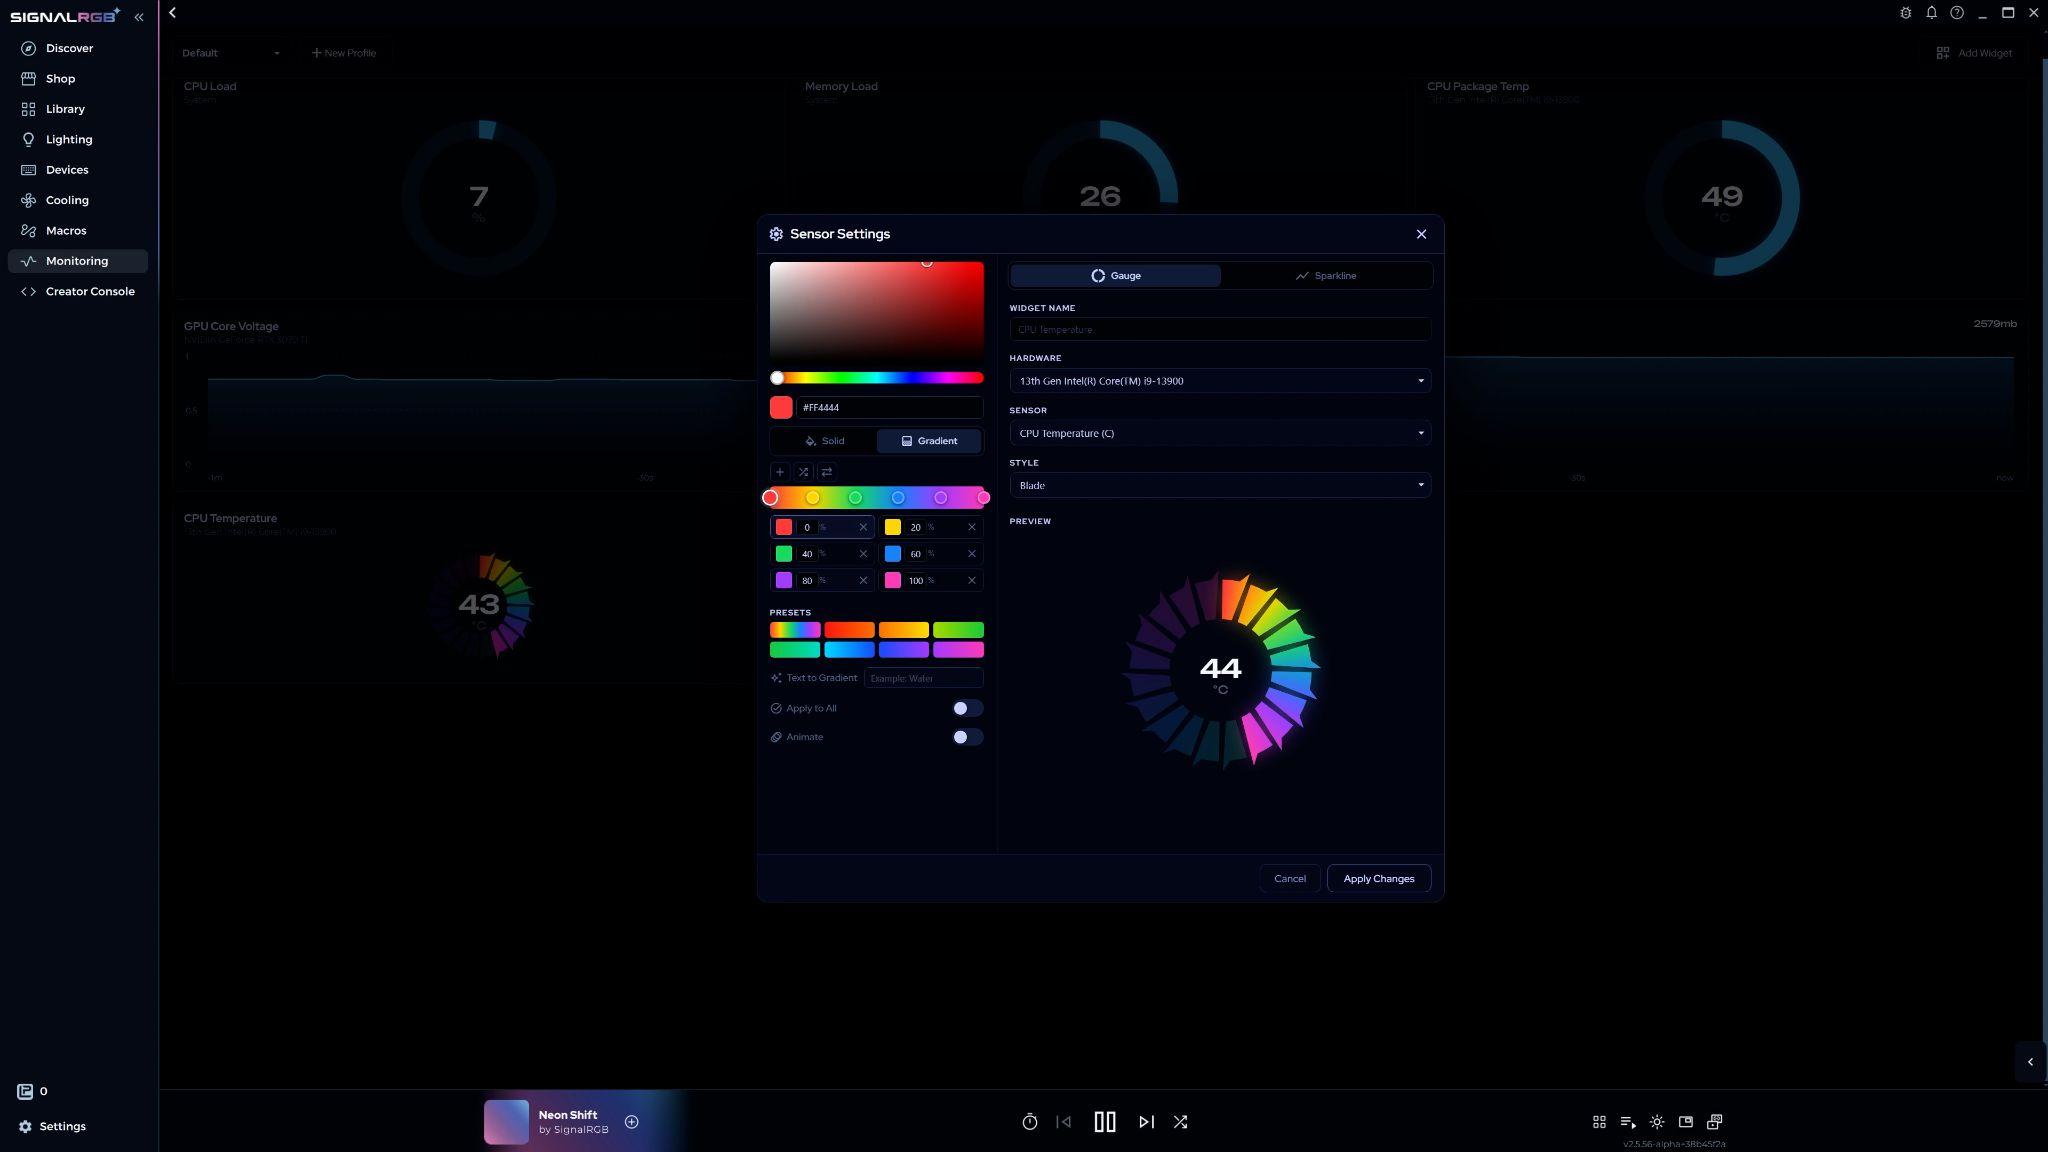
You can also start from a preset gradient. Select one from the preset panel, then adjust it using the same techniques above.
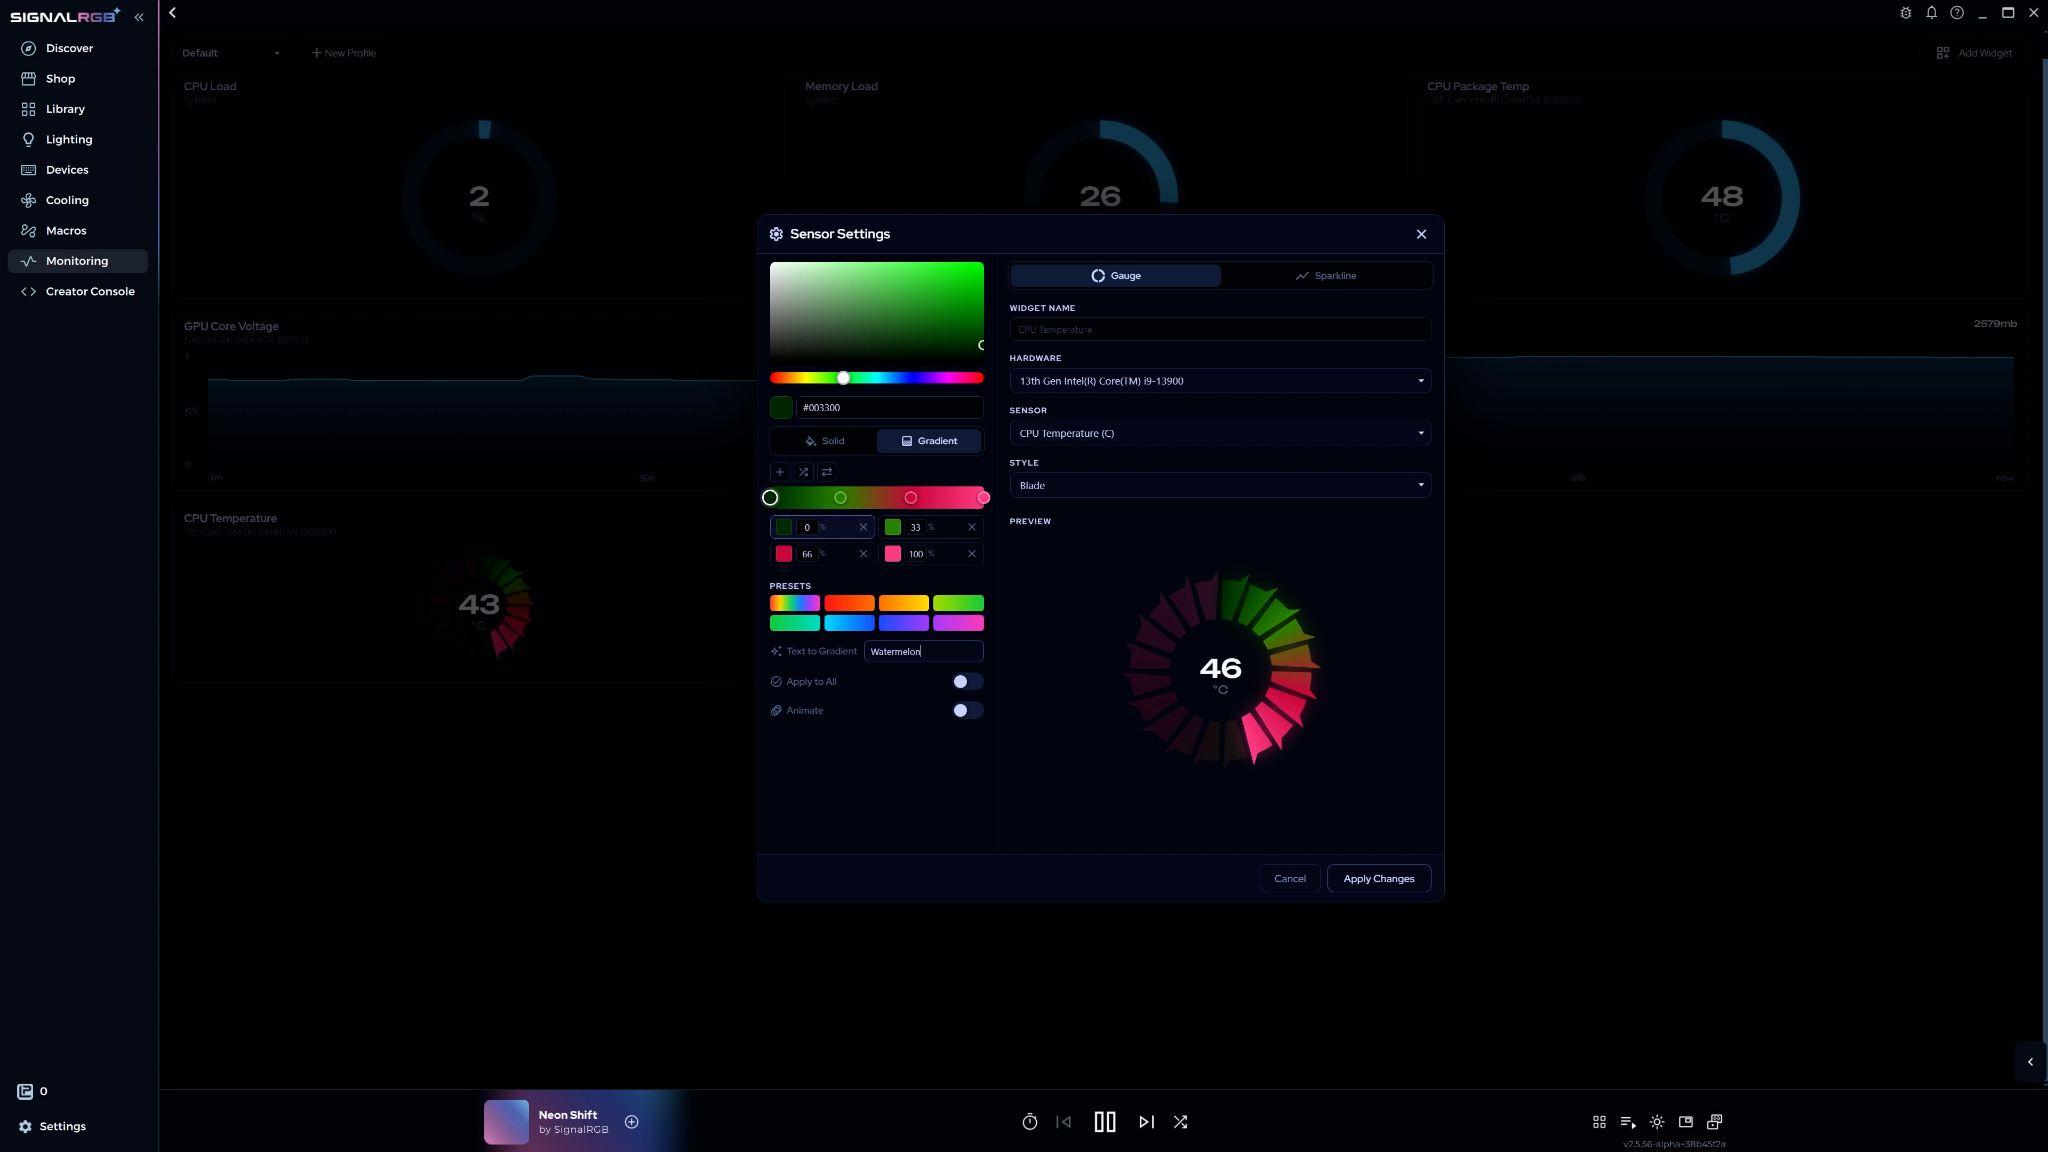
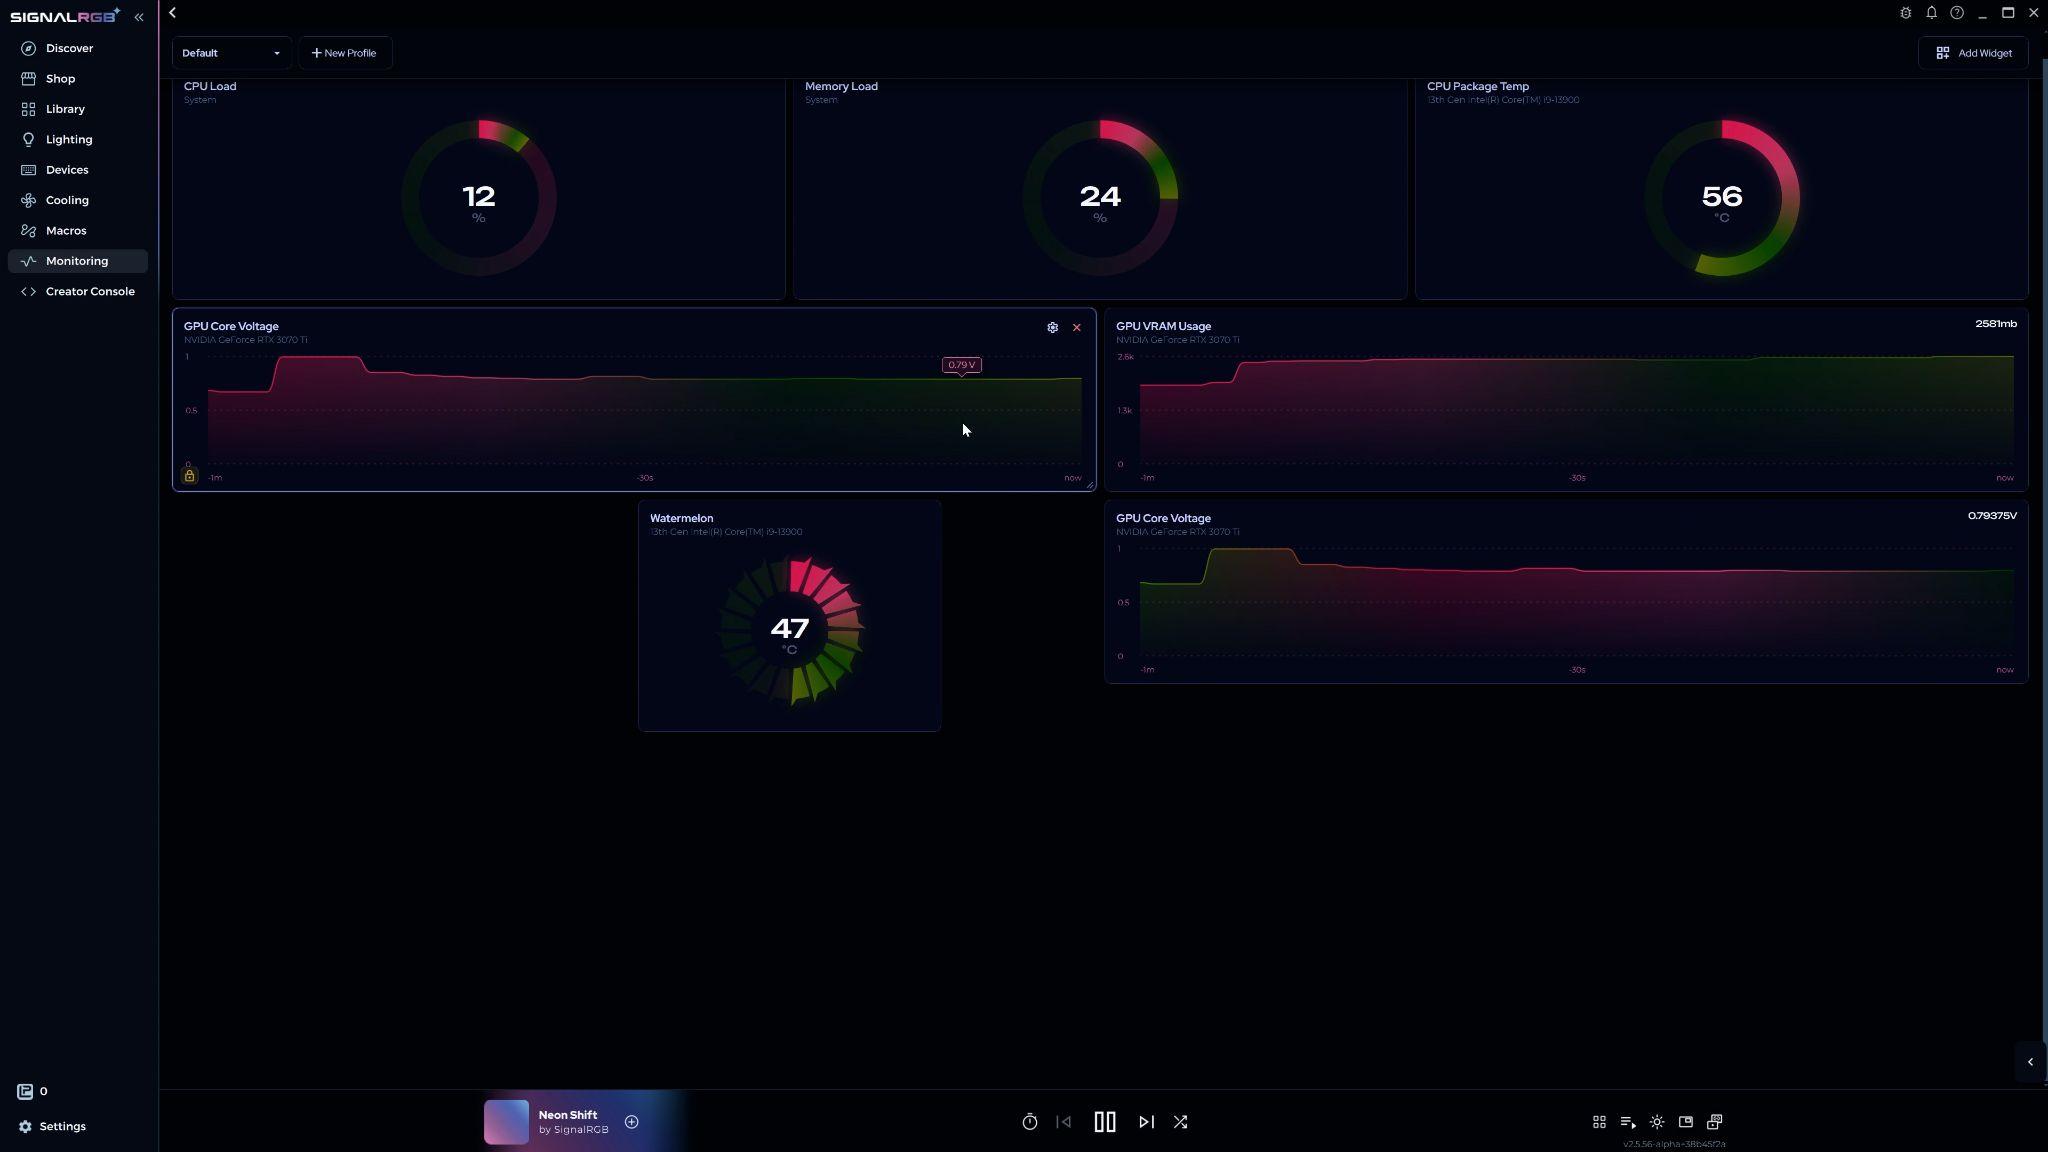
Text to Gradient generates a gradient from a word or phrase you type. For example, entering “Watermelon” produces a red and green gradient. You can modify the result like any other gradient.
Toggle Animate to make the gradient move across the widget. The colors will continuously shift.
Click Apply Changes to save and return to the Monitoring page.
Customizing Monitoring Page Layouts
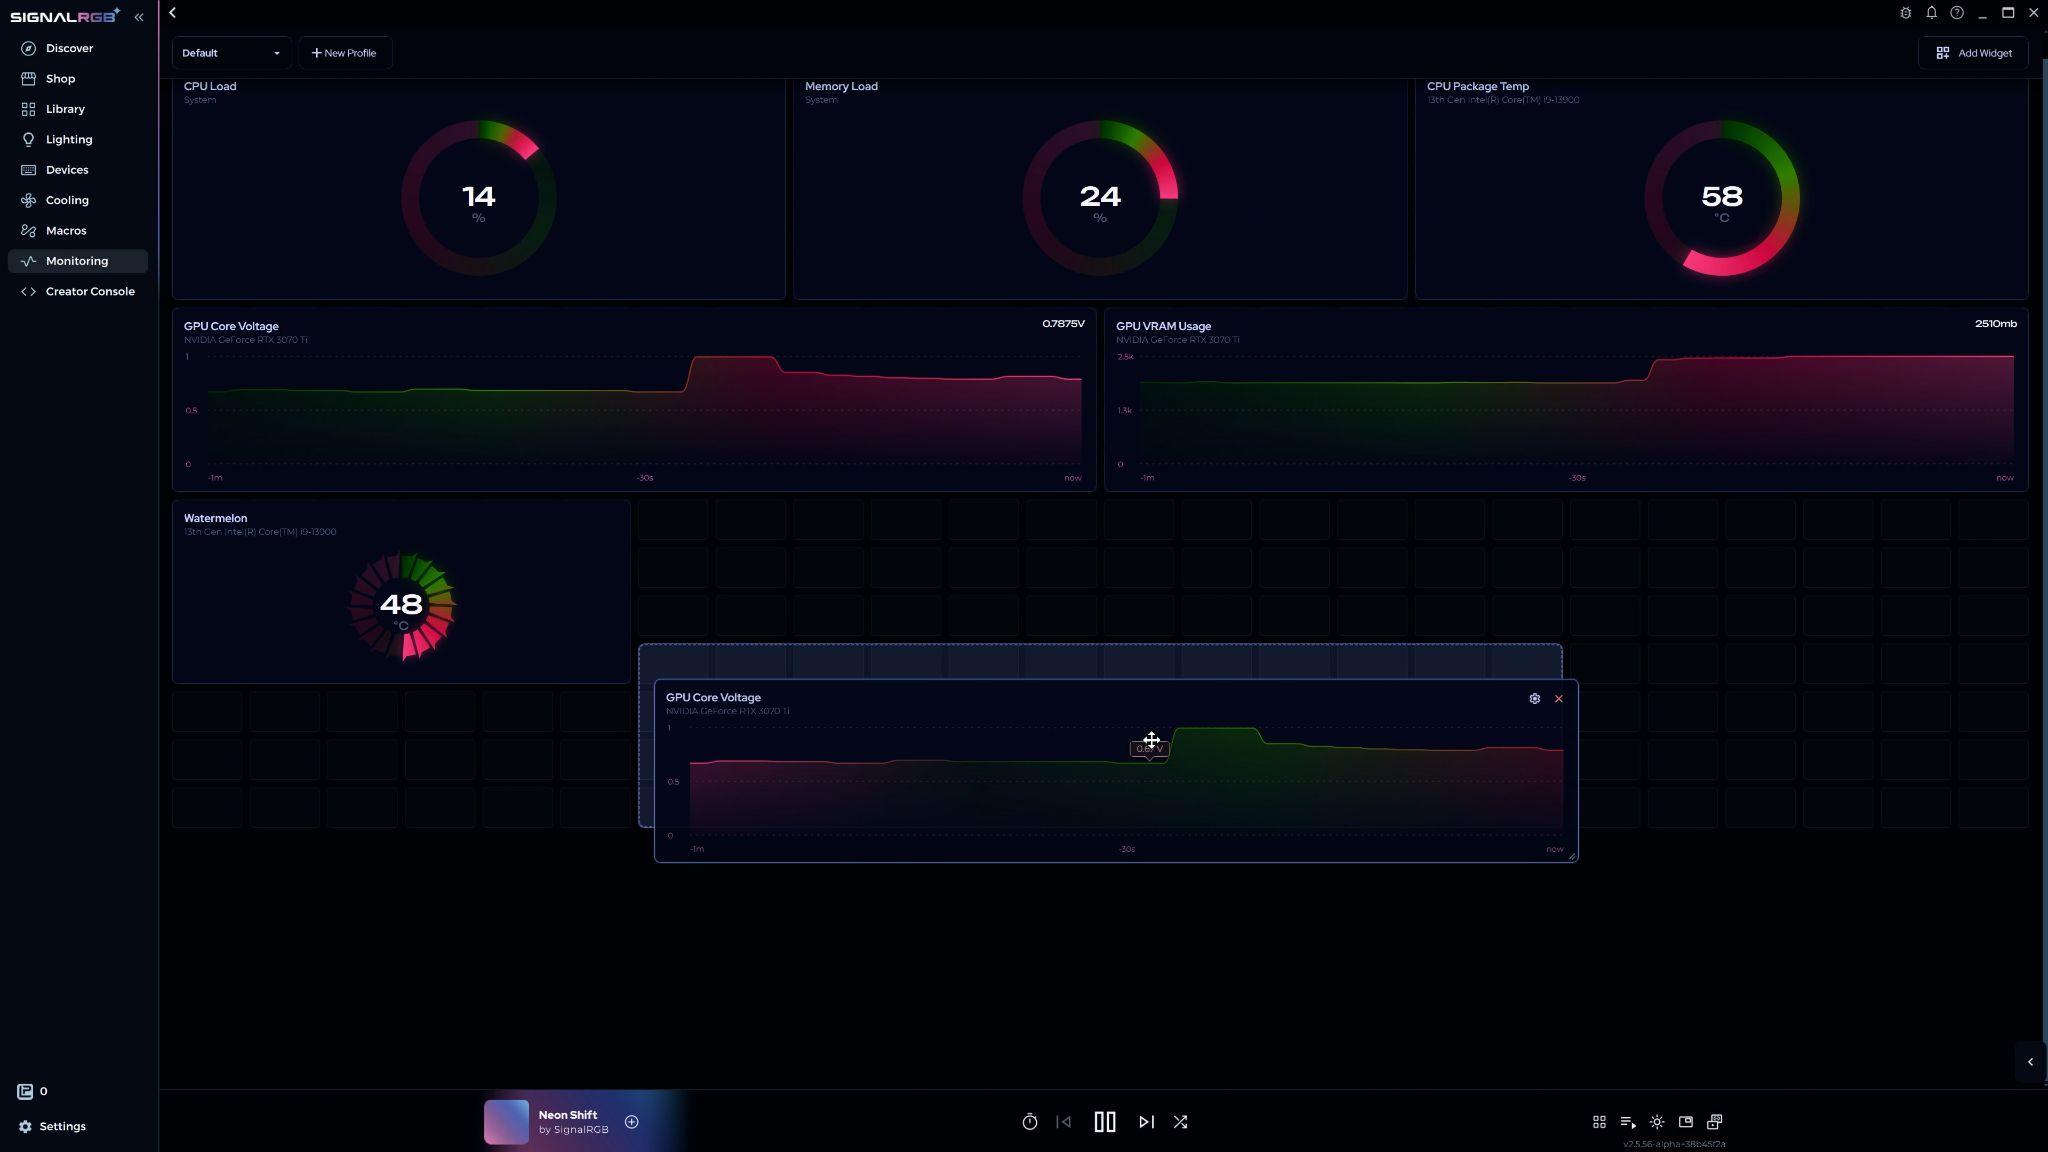
Section titled “Customizing Monitoring Page Layouts”You can move and resize widgets freely on the Monitoring page.
- Move — click and drag a widget to a new position
- Resize — click and drag from any corner
- Select multiple — drag-select several widgets to move or resize them together
- Lock — double-click a widget to prevent changes to its position or size
Saving and Switching Layouts
Section titled “Saving and Switching Layouts”To save your current layout as a profile, click New Profile in the upper-left corner.
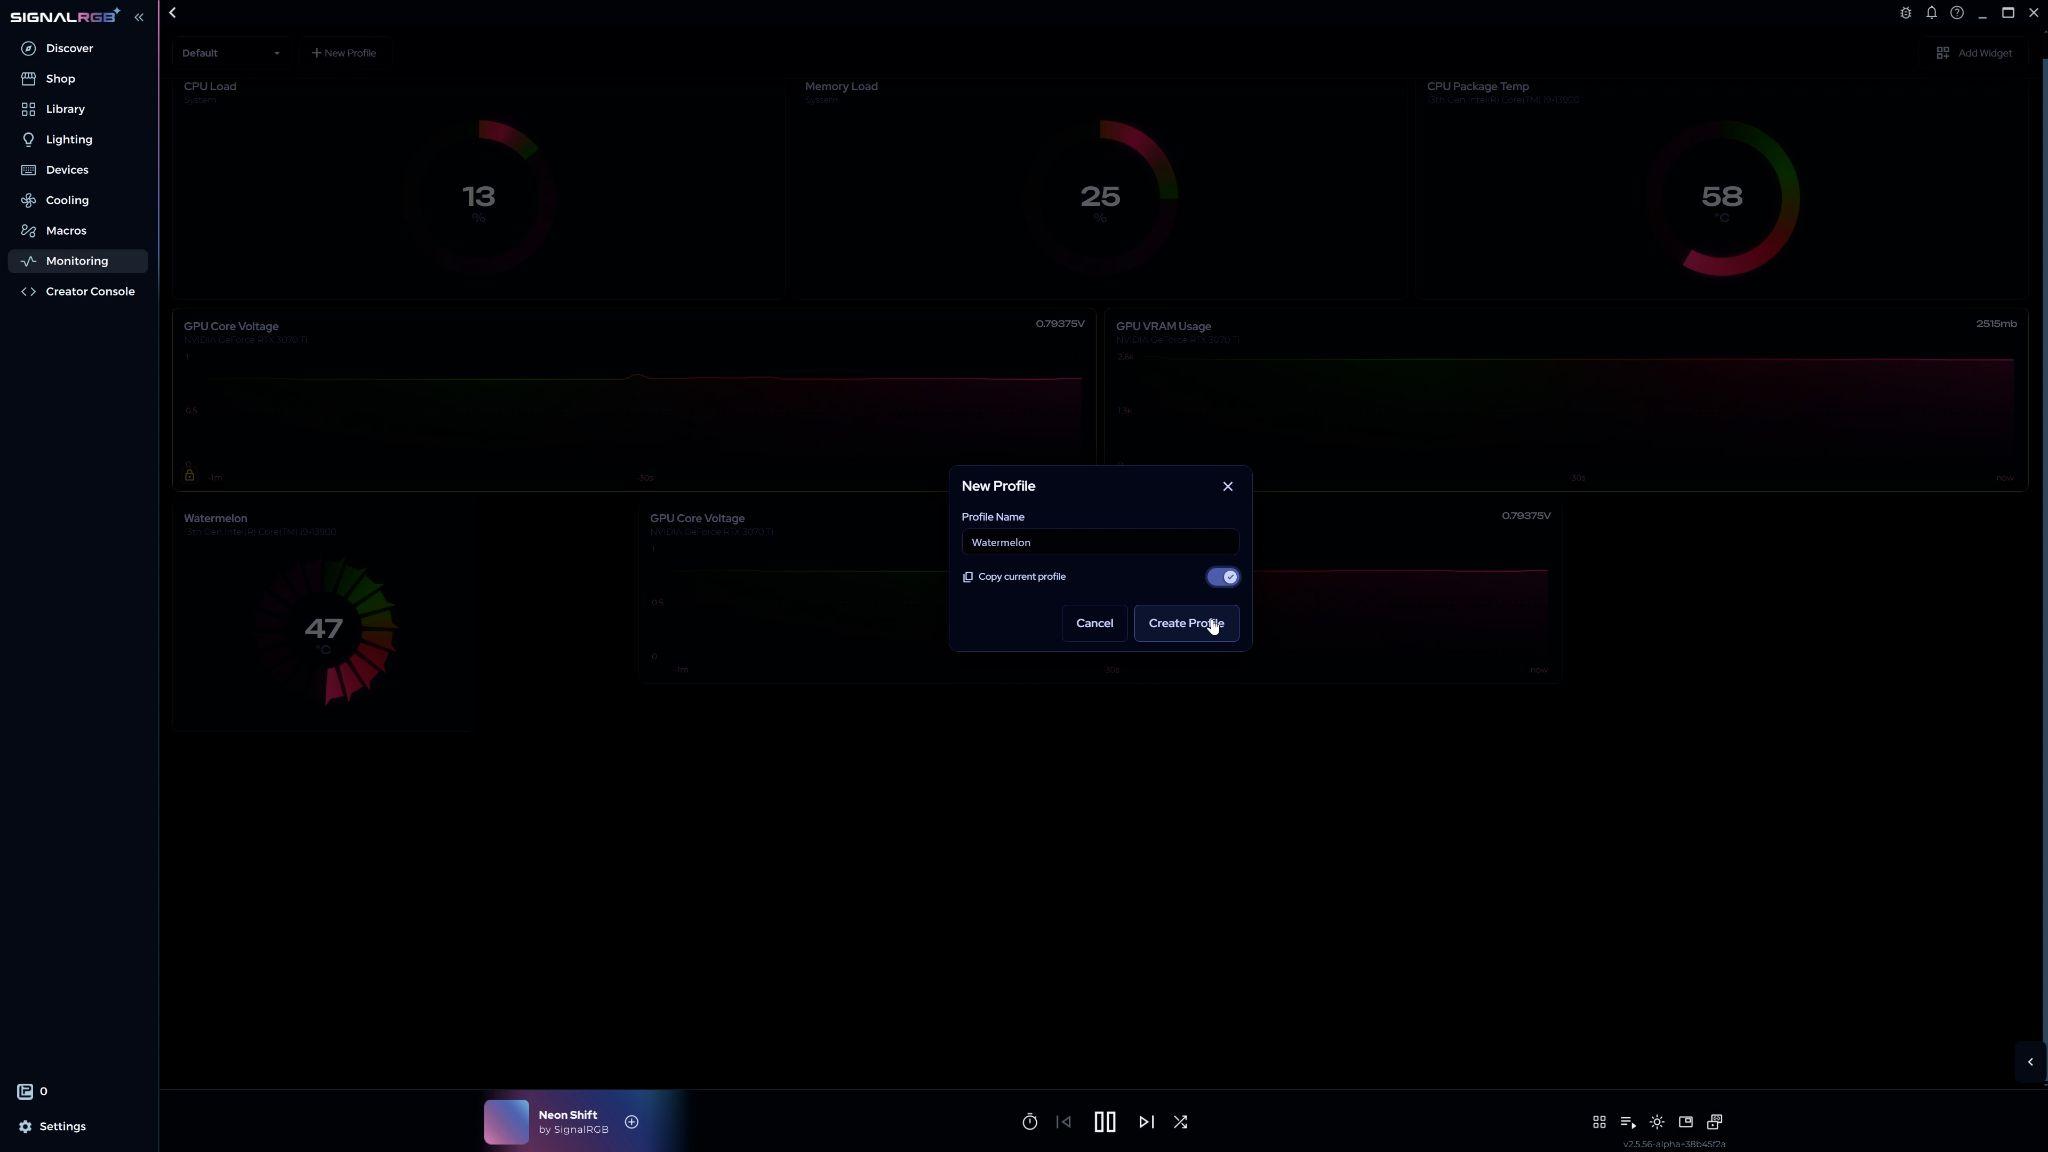
Give the profile a name and choose to copy the current layout or start from scratch. Click Create Profile to confirm.
To switch layouts, use the dropdown in the upper-left corner. All your saved profiles appear there.
Available Sensors
Section titled “Available Sensors”Widgets can read data from the following hardware sources:
System
- CPU Load (%)
- Memory Load (%)
CPU
- CPU Temperature
- CPU Package Temperature
- Individual Core Temperatures
GPU
- GPU Core Voltage
- GPU Hotspot Temperature
- GPU Memory Junction Temperature
- GPU Core Temperature
- GPU Memory Clock
- GPU Core Clock
- GPU Load (%)
- GPU VRAM Usage
RAM
- Usage
- Frequency
Storage
- Temperature (if supported by your drive and motherboard)
- Disk Speed Read
- Disk Speed Write
Fans
- RPM for all connected sensors your system exposes
Water Cooling
- Pump RPM
- Liquid Temperature
- Temperature Probes
Network
- Ping
- Download Speed
- Upload Speed
Your system may expose additional sensors not listed here.
Related Articles
Section titled “Related Articles”Need more help? Contact Customer Support