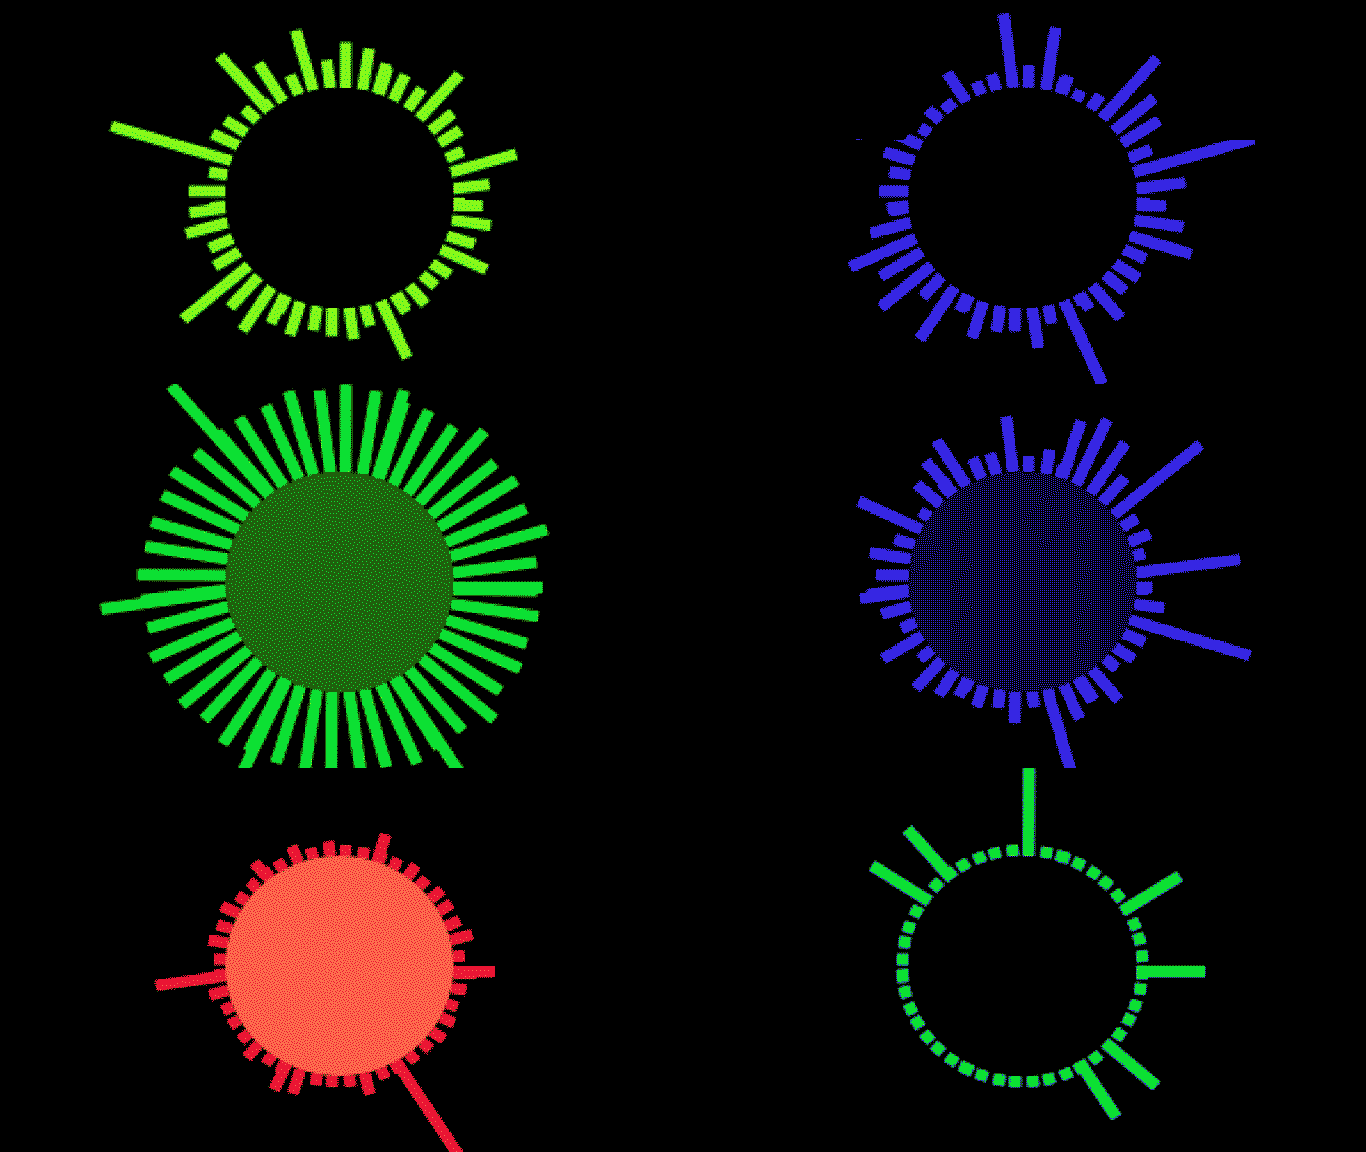
ออดิโอวิชวลไลเซอร์
ในส่วนนี้ เราจะเจาะลึกคุณสมบัติด้านเสียงบางส่วนของ API และแสดงพื้นฐานการสร้างออดิโอวิชวลไลเซอร์ให้คุณดู วิชวลไลเซอร์ส่วนใหญ่สร้างขึ้นจากหลักการพื้นฐานชุดเดียวกัน ดังนั้นเพียงฝึกฝนเล็กน้อยก็สามารถสร้างผลลัพธ์ที่สนุกมาก ๆ ได้
คุณสมบัติด้านเสียงของ SignalRGB
หัวข้อที่มีชื่อว่า “คุณสมบัติด้านเสียงของ SignalRGB”คุณสามารถเข้าถึงข้อมูลเสียงที่ SignalRGB มอบให้ได้ผ่านคุณสมบัติไม่กี่ตัวในโค้ดของคุณ:
- engine.audio.level - คืนค่าตัวเลขระหว่าง -100 ถึง 0 ซึ่งแสดงถึงความดังโดยรวมของแทร็ก 0 คือดัง ส่วน -100 คือเบามาก
- engine.audio.density - คืนค่าตัวเลขระหว่าง 0 ถึง 1 ซึ่งแสดงถึงความหยาบของโทนเสียง โดยเสียงทดสอบ (test tone) จะคืนค่า 0 และไวต์นอยส์จะคืนค่า 1
- engine.audio.freq - คืนค่าอาร์เรย์ 200 สมาชิกที่มีข้อมูลความถี่ของแทร็ก
คุณสมบัติแต่ละตัวต้องผ่านการนอร์มัลไลซ์หรือการปรับแต่งในระดับที่แตกต่างกันก่อนจะนำไปใช้งานได้อย่างเหมาะสม ซึ่งจะอธิบายในอีกสักครู่
มาเริ่มต้นด้วยแอนิเมชันความถี่พื้นฐานกัน
ความถี่
หัวข้อที่มีชื่อว่า “ความถี่”ความถี่แสดงถึงระดับเสียง (pitch) ที่เราได้ยิน และเป็นคุณสมบัติที่สำคัญที่สุดสำหรับออดิโอวิชวลไลเซอร์ สิ่งที่เราทำในที่นี้คือการนำคลื่นความถี่ 200 ส่วนในแต่ละเฟรมมาแปลงเป็นภาพ ขั้นตอนพื้นฐานมีดังนี้:
- สร้างอาร์เรย์และเติมข้อมูลความถี่ลงไป
- แก้ไขอาร์เรย์นี้ให้เหมาะกับความต้องการของคุณ (filter, map, reduce ฯลฯ)
- เขียนคลาส “แท่งเสียง” (sound bar) เพื่อแทนสมาชิกแต่ละตัว
- เชื่อมข้อมูลเข้ากับคลาสแท่งเสียงในทุกเฟรม
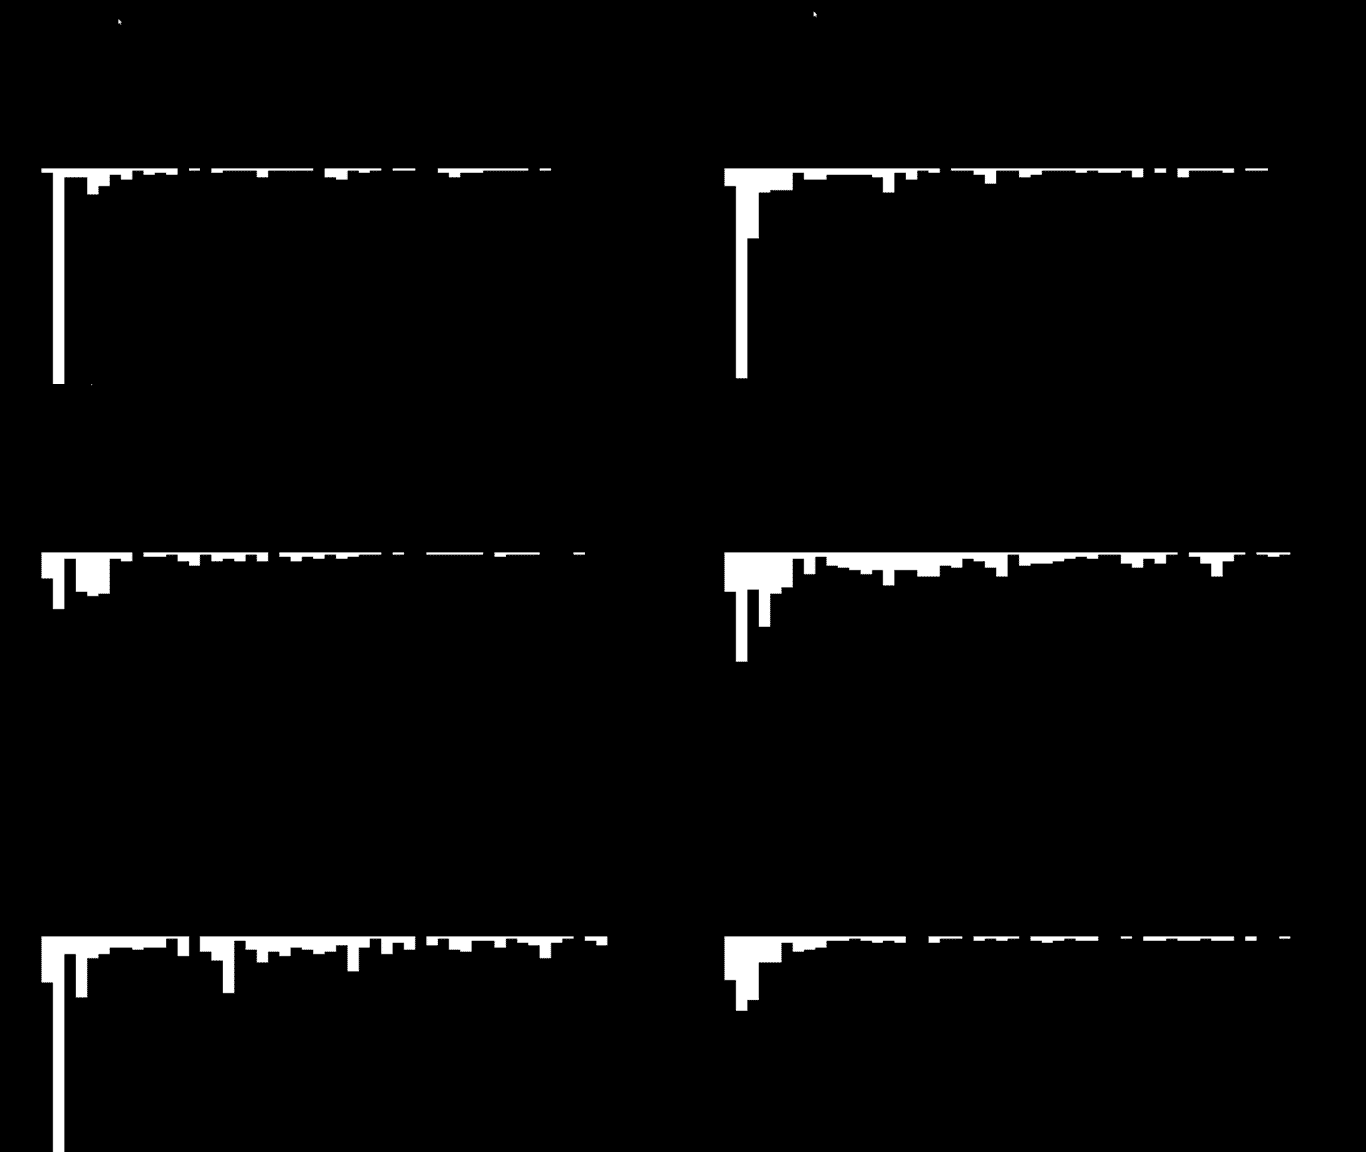
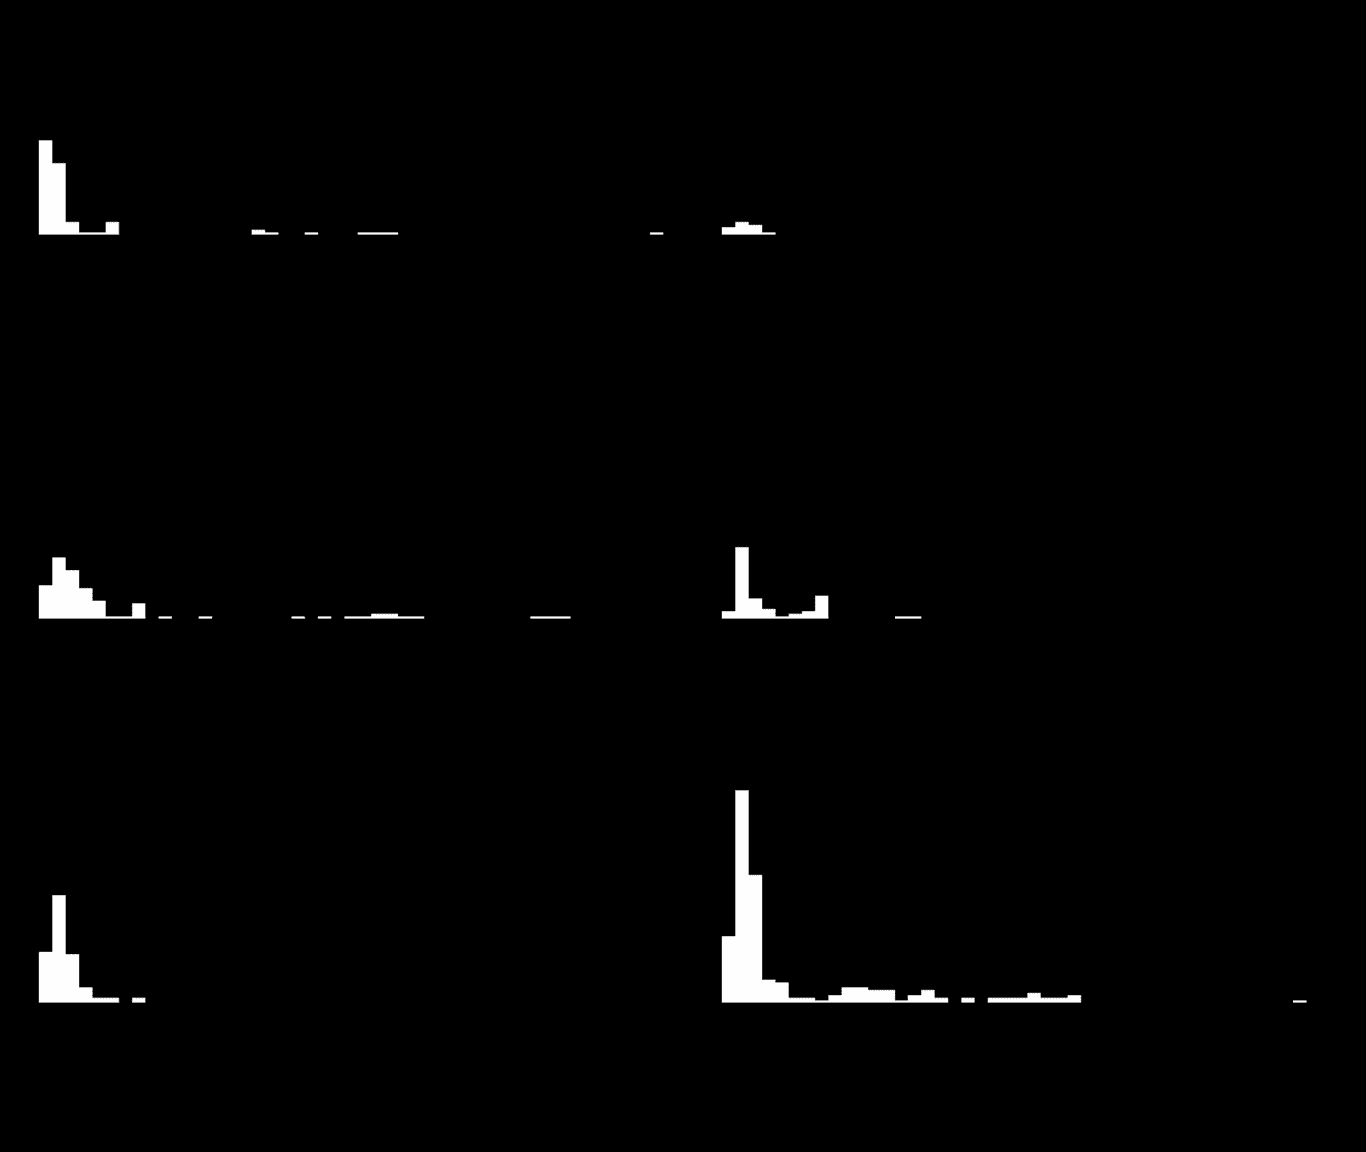
สิ่งสำคัญเกี่ยวกับความถี่คือ เราต้องปรับข้อมูลดิบสองอย่าง บางครั้งสมาชิกอาจมีค่าติดลบ ซึ่งทำให้ภาพดูสะดุดตา นอกจากนี้ความสูงของสมาชิกในตัวอย่างนี้ก็ยังไม่ถูกต้อง เนื่องจากค่าบวกในตัวเลือก “height” ของสี่เหลี่ยมจะวาดลงด้านล่างจากจุดกำเนิดของรูปทรง เราจึงต้องกลับด้านค่าเหล่านี้เพื่อให้ดูเหมือนวิชวลไลเซอร์ทั่วไป
ตัวอย่าง - ข้อมูลที่ยังไม่ผ่านการประมวลผล:
ข้อมูลที่ผ่านการประมวลผลแล้ว:
ตัวอย่างโค้ดที่ใช้ข้อมูลที่ผ่านการประมวลผลแล้ว:
<head>    <title>Visualizer Tutorial</title>    <meta description="Basic Effects" />    <meta publisher="SignalRgb" />  </head>
  <body style="margin: 0; padding: 0; background: #000;">    <canvas id="exCanvas" width="320" height="200"></canvas>  </body>
  <script>    canvas = document.getElementById('exCanvas');    ctx = canvas.getContext('2d');    var effects = [];    var reducedFreq = [];
    function update() {
      // "frequency" represents the full 200 elements from our frequency data        var frequency = new Int8Array(engine.audio.freq)      // "reducedFreq" filters the data down to every fourth result to save some CPU load        reducedFreq = frequency.filter((element, index) => {            return index % 4 === 0;        })
      // Create the effect if it does not yet exist        if(effects.length < 1){            effects.push(new soundBars(20, 100))        }
      // Background color        DrawRect(0, 0, 320, 200, "black")
      // Play effect        effects.forEach((ele, i) => {          ele.draw();          if (ele.lifetime <= 0) {            effects.splice(i, 1);          }        });
      window.requestAnimationFrame(update);    }
    function soundBars (x, y){        this.x = x;        this.y = y;        this.draw = function(){          for(let i = 0; i < reducedFreq.length; i++){                var x = this.x + 5 * i                var y = this.y     // Data processing occurs for "height". Find the absolute value of each element, then flip negative                var height = -Math.abs(reducedFreq[i])                DrawRect(x, y, 5, height, "white")            }        }    }
    function DrawRect(x, y, width, height, color) {      ctx.beginPath();      ctx.fillStyle = color;      ctx.fillRect(x, y, width, height);    };
    window.requestAnimationFrame(update);  </script>
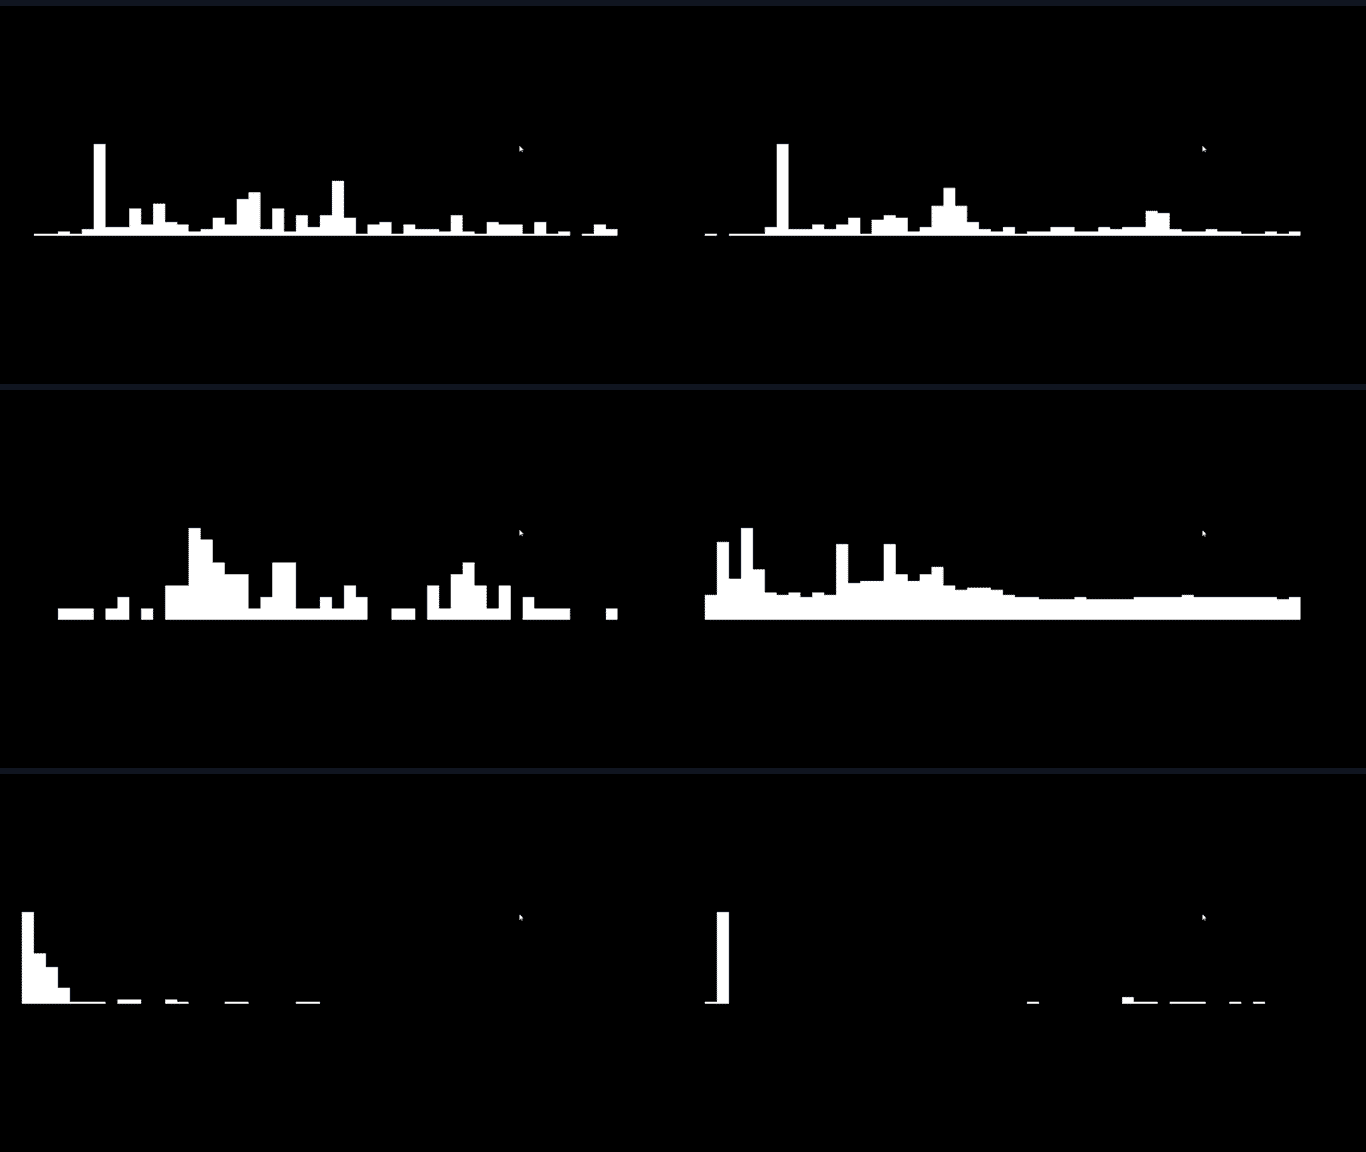
อย่างไรก็ตาม วิชวลไลเซอร์ข้างต้นยังมีปัญหาอยู่บ้าง แม้ว่าเพลงจะฟังดูสมดุลดีผ่านหูฟังของเรา แต่เราจะเห็นว่าข้อมูลเอนเอียงไปทางแท่งเสียงบางแท่งอย่างมาก และมักทำให้แท่งอื่น ๆ มองไม่เห็นเลย ในแง่ศิลปะแล้วสิ่งนี้ไม่ใช่ผลลัพธ์ที่ดีนัก เราจึงจะ “นอร์มัลไลซ์” ข้อมูลที่ได้รับจาก SignalRGB การนอร์มัลไลซ์คือการกระจายข้อมูลอย่างสม่ำเสมอระหว่างจุดสูงสุดและจุดต่ำสุด เพื่อแสดงค่าของข้อมูลเมื่อเทียบกันได้ดีขึ้น หลังจากหาค่าสูงสุดและค่าต่ำสุดในอาร์เรย์ความถี่แล้ว สมการโดยรวมก็ค่อนข้างง่าย: (x - min) / (max - min) โดย “x” แทนสมาชิกปัจจุบัน
ข้อมูลที่ผ่านการประมวลผลและนอร์มัลไลซ์แล้ว:
ต่อไป เราจะเพิ่มความโดดเด่นอีกเล็กน้อยด้วยการจัดเรียงแท่งเสียงให้เป็นวงกลม:
function soundBars (x, y){      this.x = x;      this.y = y;
      this.draw = function(){
        var max = Math.max(...reducedFreq)        var min = Math.min(...reducedFreq)
        for(let i = 0; i < reducedFreq.length; i++){          //Save the current state of the canvas          ctx.save()          //Add the circular component to your bars. "50" here is the radius of the circle          var x = this.x + Math.cos(i) * 50          var y = this.y + Math.sin(i) * 50          var height = ((Math.abs(reducedFreq[i])) - min) / (max - min) * -40          // Determine the angle of the bar, to make it perpindicular to the circle          var rotate = Math.atan2(y - this.y, x - this.x) + Math.PI / 2;          //Translate to circle center          ctx.translate(x, y)          //Rotate the canvas          ctx.rotate(rotate)          //Translate back for drawing          ctx.translate(-x, -y)          DrawRect(x, y, 5, height, "white")          //Restore the old state of the canvas after drawing to prevent positive feedback loops          ctx.restore()        }      }    }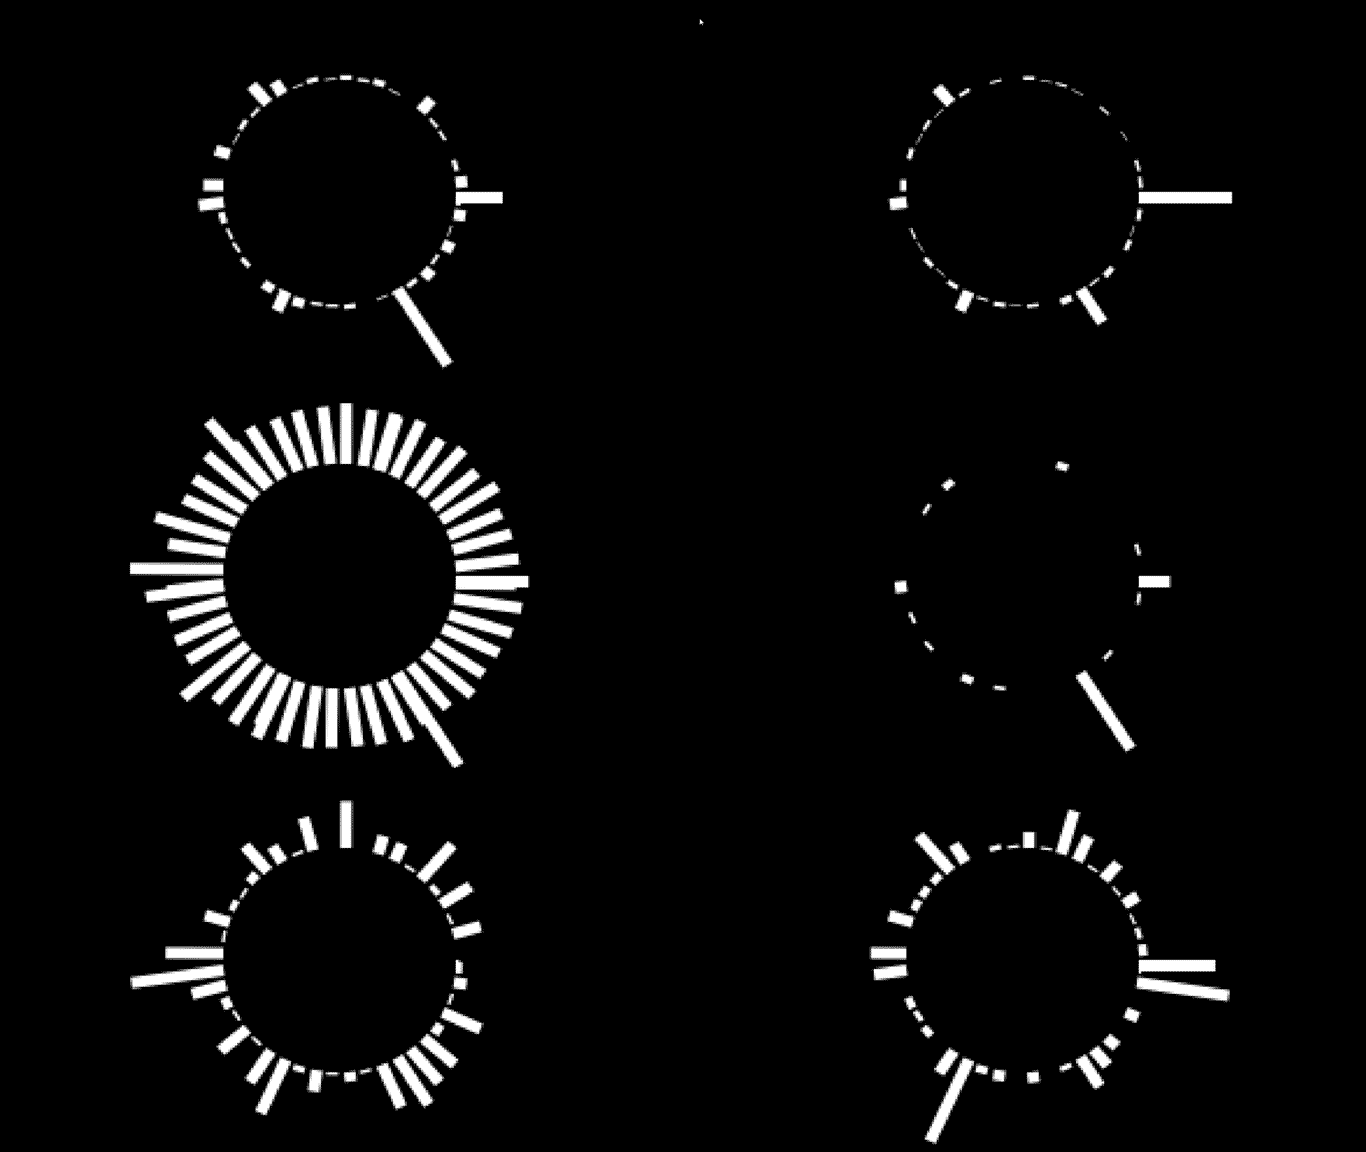
ความหนาแน่น
หัวข้อที่มีชื่อว่า “ความหนาแน่น”ความหนาแน่น (density) ใช้งานง่าย ค่าที่คืนกลับมาจะเป็นตัวเลขระหว่าง 0 ถึง 1 ซึ่งแสดงถึง “ความสะอาด” ของโทนเสียง เสียงดิจิทัลจะมีค่าใกล้ 0 และเสียงแอนะล็อกจะมีค่าใกล้ 1 ในตัวอย่างนี้ เราจะใช้ค่านี้เพื่อปรับสีของแท่งเสียง ซึ่งจะทำให้โทนเสียงที่แตกต่างกันในเพลงของคุณมีสีที่แตกต่างกัน
function soundBars (x, y){
      this.x = x;      this.y = y;      this.rotate = 0;
      this.draw = function(){        //Hue is calculated each frame, the resulting amount will be a proper hue option for hsl        var hue = engine.audio.density * 360
        var max = Math.max(...reducedFreq)        var min = Math.min(...reducedFreq)        for(let i = 0; i < reducedFreq.length; i++){          ctx.save()          var x = this.x + Math.cos(i) * 50          var y = this.y + Math.sin(i) * 50          //Height slightly edited for visability          var height = ((Math.abs(reducedFreq[i])) - min) / (max - min) * -50 - 5          this.rotate = Math.atan2(y - this.y, x - this.x) + Math.PI / 2;          ctx.translate(x, y)          ctx.rotate(this.rotate)          ctx.translate(-x, -y)          //Insert the edited hue value each frame          DrawRect(x, y, 5, height, `hsl(${hue}, 100%, 50%)`)          this.rotate = 0;          ctx.restore()        }      }    }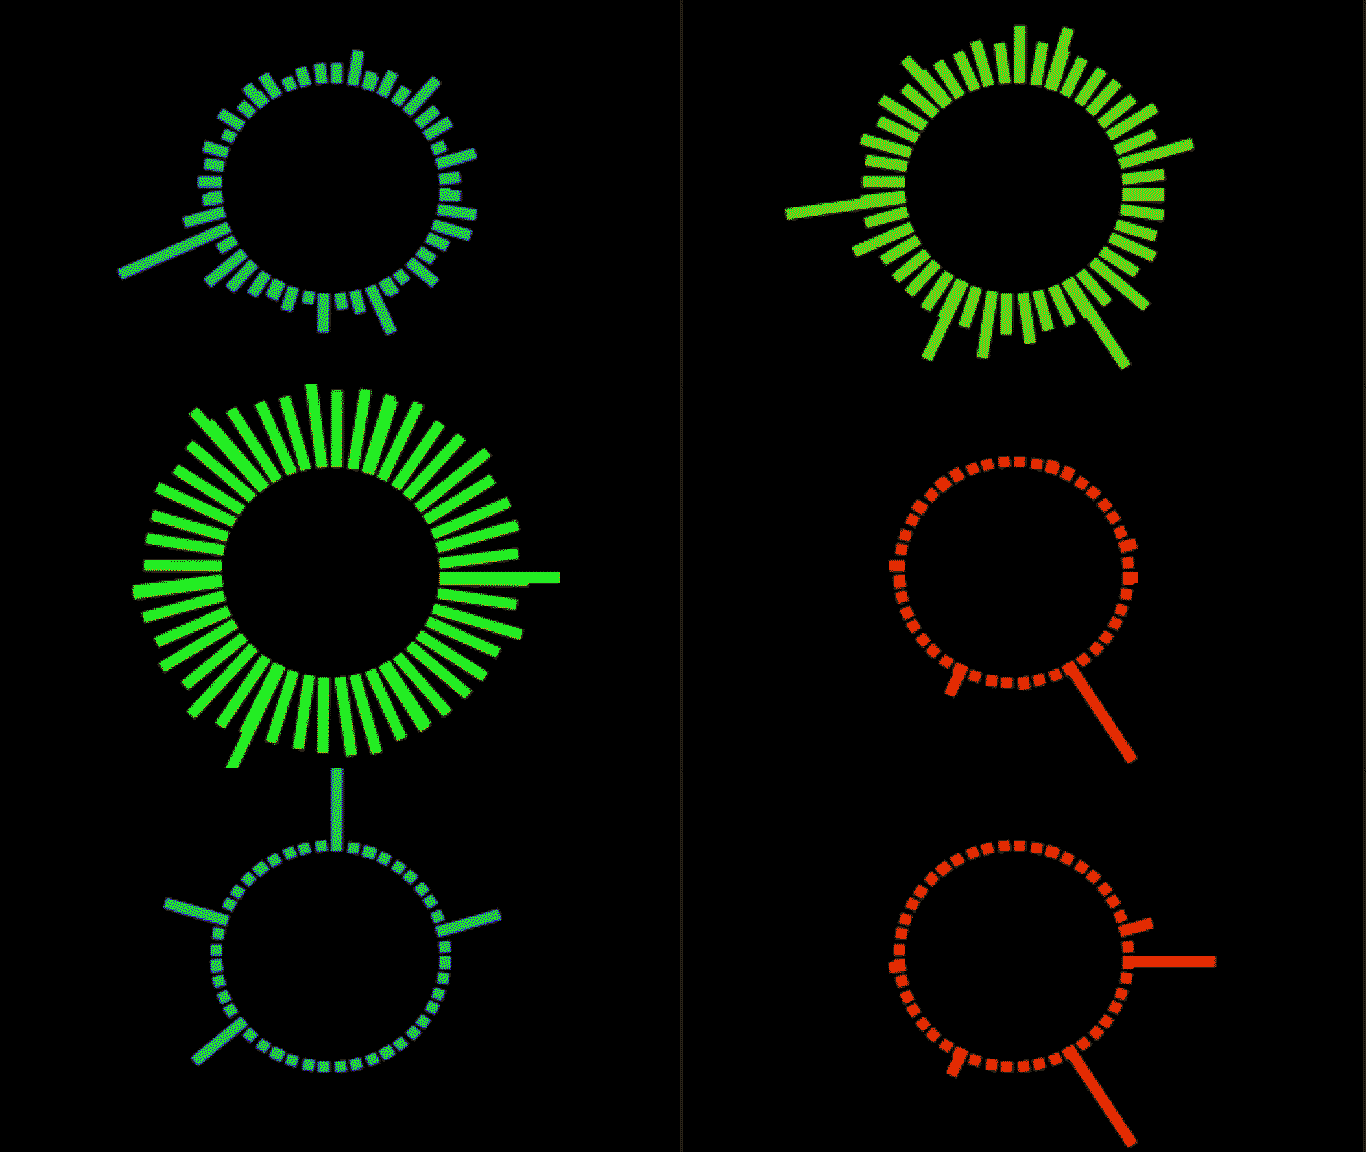
ระดับเสียง
หัวข้อที่มีชื่อว่า “ระดับเสียง”คุณสมบัตินี้เพียงคืนค่าความดังของแทร็กในหน่วยเดซิเบล โดยจุดที่ต้องระวังคือค่าที่ได้จะเป็นตัวเลขระหว่าง -100 ถึง 0 โดย -100 คือเงียบมาก และ 0 คือดังมาก เราต้องปรับแต่งข้อมูลนี้เล็กน้อยเพื่อใช้งานตามที่ต้องการ และจะวาดรูปทรงนี้ในฟังก์ชัน update ของเรา ในที่นี้ ระดับเสียงของแทร็กจะปรับความสว่างของวงกลมสีดำด้านใน
function update() {
        var frequency = new Int8Array(engine.audio.freq)        reducedFreq = frequency.filter((element, index) => {            return index % 4 === 0;        })
        if(effects.length < 1){            effects.push(new soundBars(160, 100))        }
        DrawRect(0, 0, 320, 200, "black")
        effects.forEach((ele, i) => {          ele.draw();          if (ele.lifetime <= 0) {            effects.splice(i, 1);          }        });
        // Hue calcualtion to match the rest of the visualizer        var hue = engine.audio.density * 360        //The level has been multiplied by 10, then added to 100. This is arbitrary, but some combination         of actions here will give you the result you want        DrawCircle(160, 100, 50, `hsl(${hue}, 100%, ${100 + engine.audio.level * 10}%)`)
      window.requestAnimationFrame(update);    }